• Skip to primary navigation
  • Skip to main content
  • Skip to primary sidebar

By's Musings

  • Home
  • Blog
  • Overview

Higher Education

September 10, 2016 By B. Baylis Leave a Comment

Broken Business Model of American Higher Education, Part VI: Incremental Growth Will Not Be Enough

courtesy of Presenter Media

I am finally returning to my series on the broken business model of American higher education. In previous installments of this series, I have indicated that I believe the sprawling educational multiplex on which the United States relies and to which much of the world admiringly looks for leadership is sputtering and struggling to catch its breath, I think  American higher education is caught between a rock and a hard place. I am convinced that it has reached an important fork in its road. Which way should we go? The future prosperity of American higher education is potentially at stake.

I suspect many of you are cringing at my use of the word prosperity with respect to higher education. I intentially used the business term “prosperity” in this context. I can hear people screaming at their computer screens: “Higher education is not a business.” Folks, other than in the form of a vigorous denial, you won’t hear that expression from me. I’ve said it before, and I’ll say it again: “Higher education is a business.” See my previous post, According to the Duck Test, Higher Education is a Business. If you see an animal in the barnyard that has feathers like a duck, flies like a duck, waddles like a duck, quacks like a duck, swims like a duck, and looks like a duck, then it is a very safe bet that it is a duck.

courtesy of Presenter Media

I believe that much of the difficulty and confusion comes from the fact that education is more than a business. In addition to being required to operate as a business, it is a ministry, an agency of  service to individuals, communities, our country and the world. It provides a public and private good. It offers aid, assistance, help and utility. I put it in the same pigeon hole as the fields of medicine, and charitable service enterprises. All of these enterprises offer indispensable assistance and benefits to their clients, communities and the human race. I have heard many call for these initiatives to be held to higher standards of accountability than we demand of the companies from which we obtain our meals and groceries. We seem to have far fewer problems with businesses offering inferior services to customers or clients, than requiring service organizations to maintain their obligations to operate according to the legal requirements that all businesses are suppose to meet.

courtesy of Presenter Media

The past several postings in this series have been about growing enrollment. I believe that American higher education has reached a point of decision at which it must pick between two very different paths. This choice will define unique and important historical options that will have far reaching consequences. If you are completely turned off by the idea that higher education should be described in business and economic terms, will you allow me to use the medical analogy of the health of American higher education?  Have we reached a point where the future health of American higher education may conceivably be at stake? Is it time to check its temperature, heart rhythm,  AIC, cholesterol levels, BMI and the electrical activity of the brain?

courtesy of Presenter Media

Most educational pundits, critics and commentators, friendly or otherwise, readily admit that American higher education has come through some very trying times and will definitely face some more problems, and possibly even crises in its immediate future. The decisions that American higher education must make can be formulated in a number of different terms. The problems facing American higher education are complex and multifaceted. This means that we must be prepared to wade through knee-deep, involved puddles of mud to get close to understanding the problem before we can formulate and begin to implement a remedy that will alleviate the current difficulties.

From previous posts in this series, I have tried to present the argument that American higher education is facing financial problems and pressures. The enterprise doesn’t have enough money to do what it’s currently doing. It is also far short of having the funds to do what it and seemingly most of the American public wants it to do. In this series I have proposed that American higher education has five sources of revenue. In the first post of the series, The Business Model of All of Higher Education is Broken, I listed five possible sources of revenue for American higher education:

  1. Tuition and fees;
  2. Fundraising, advancement or development efforts;
  3. Endowment income, appreciation, interest or dividends;
  4. Auxiliary enterprises; and
  5. Government appropriations (Reserved for public institutions).

Previously in this series, I have concentrated on revenues from tuition and fees. The two easiest ways to enlarge this revenue pot are either by increasing the tuition and fees charged each student, or by growing enrollment, i.e., increasing the number of students paying the tuition and fees. I have attempted to show that institutions would be fighting a losing battle if they attempted to increase the tuition and fee charges sufficiently to cover their current needs or future desires. Student, families, politicians and the general public already believe that tuition and fees are too high. In the most recent post in this series, The Business Model of All of Higher Education is Broken, Part V: Increasing Enrollments is Not Enough, I began to consider the difficulties in increasing enrollments to gain more revenue. I continue that line of reasoning in this post.

Business strategists, economists and mathematicians typically talk about two types of growth: incremental and exponential. Incremental growth is normally represented on a graph by a straight line. With this type of  growth, the number grows by approximately the same amount in each period of time. Its graph is best approximated by a linear function. On the other hand, exponential growth is an upward-opening, concave curved line.  In exponential growth, the number grows at a rate that is proportional to the number’s current value, resulting in its growth with time being an exponential function. Its graph is best approximated by an exponential function, with a leading exponent of the independent variable equal to 2 or greater. To illustrate the difference, consider the following fabricated example of college enrollments in a fictitious country.

Enrollment in fictitious country to illustrate the problems with incremental growth. Chart created by author using Google Sheets

The graph begins at a point in the history of our fictitious country where the current enrollment is 20 million students. If our country does nothing different year after year, the enrollment would tend to stay constant (bright green line on the graph). The incremental growth graph (red line) is approximated by a straight line with a slope of positive 1. This means that for each year, the enrollment grows by 1 million students.. The exponential growth graph (blue line) is approximated by a quadratic function.  The quadratic growth model represents a disruptive change, such as switching to online degree programs,  which at first causes a slight decline in enrollment before the exponential growth kicks in. Our Combination Model  (the purple line) represents a combination of adding the online program plus the incremental growth from adding students to the traditional programs.

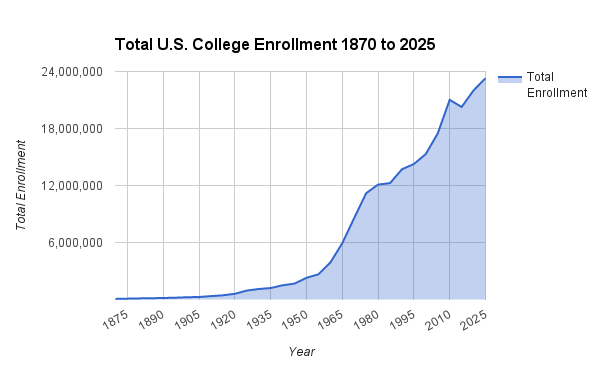
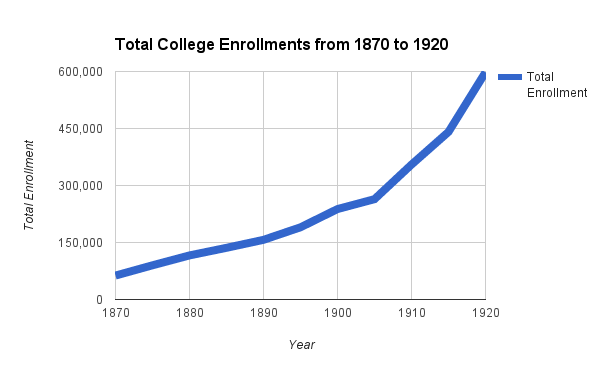
The enrollment numbers for this fictitious country are not completely unimaginable. The current enrollment in the United States is approximately 20 million. According to the Institute of Education Sciences (IES) of the National Center of Education Statistics (NCES), it is expected to growth by almost 5 million students in the next 5 years. For the first 200 years of American higher education, enrollment did double approximately every 10 to 15 years. If you dig into those statistics you will find that those staggering enrollment increases followed disruptive changes in American society and higher education. There were earth shaking events and government reforms that contributed mightily to  the enrollment growths. The slow down and eventual leveling off enrollment growths of the past half century would require new earth shaking events or changes to American higher education to put it back on the path to doubling enrollment every 10 to 15 years. However, this growth is exactly what political and educational pundits desire and suggest that American society must have. We have both presidential candidates of the major political parties suggesting that the economic recovery of the United States must be built on the backs of high tech jobs and increased educational opportunities. Both have suggested that we must double the number of college graduates in the next decade. I only see two ways to double the number of graduates in the next decade. FIrstly, we must either improve our college completion rate from approximately 50% to essentially 100%. We haven’t really come close to that goal with high school education and look at all the flak that secondary education is receiving over graduating unprepared students. The second approach is to essentially double the number of students entering college. For my response to this, see my first point.

from Presenter Media

However, it is not just Americans crying for these increases in higher education enrollments. You have Education Dive’s headline of August 12 blaring out College enrollments to double in next decade. I invite you read this article for yourself and follow the leads in the article to their sources. It is not a pretty picture the author, Jarrett Carter, is painting concerning American higher education. What’s American higher education to do? As with any work of suspense, I break off my story with our hero hanging by his fingers from the edge of the cliff and leave the resolution for another installment. Please stay tuned.

Filed Under: Business and Economics, Higher Education, Politics Tagged With: College, Economics, Enrollment, Graduation, Student

August 24, 2016 By B. Baylis Leave a Comment

The Business Model of All of Higher Education Is Broken–Part V Increasing Enrollments Is Not Enough

For some in American higher education, the headline College enrollments to double in next decade that appeared in the July 12, 2016, edition of Education DIVE, a daily online newsletter of news from all aspects of education, may have seemed like the message from on high that they desperately wanted to see and hear. However, if American Institutions of Higher Education (IHEs) are counting on this touted coming influx of students for the future health of their institutions, they are going to be sadly mistaken.

This installment is the fifth part in a series on the economic conditions in American higher education. The preceding installment, The Business Model of All of Higher Education is Broken: Part IV — Tuition and Fees, dealt with the general trend of increasing the share that tuition must cover of an institution’s  Education and Related Costs (E & R Costs). However, in The Business Model of All of Higher Education is Broken: Part III — Tuition and Fees, we saw that students and their families are resisting any and all suggestions that increasing individual students’ tuition and fees should provide a possible solution to higher education’s financial difficulties. Students and families are saying, “Enough is enough! We’ve paid our fair share!” This thought is only reinforced by politicians saying that four years of public college education should be free for every one or at least the overwhelming majority of the American public. This means that to realistically get more money out of the Tuition & Fees Bucket, institutions must increase the number of students paying the current or possibly even lower tuition charges. If institutions are counting on many new students saving them from financial disaster, there are several significant holes in this strategy.

from Presenter Media

In spite of the bold headline, the first hole in this strategy is what I believe is the mistaken belief of many leaders in the American higher education megaplex that there is a seemingly unending and ever expanding supply of students who will pay any price to be part of the American higher education scene. The preceding post in this series presented some of the arguments against raising tuition. Two recent articles in education press circles clearly show the strategy of counting on continuously growing enrollments may soon blow up in the face of traditional IHEs. While the Education DIVE headline  appears to bolster the claim that there is a growing supply of fresh bodies for American IHEs, it conveniently omitted the fact that the article was referring to “the number of students in colleges and universities across the globe will double by 2025.”  As you read the article, it does admit that enrollments at U.S. colleges are falling. Are they trying to rain on the parade of educational expansionists?

In the Nineteenth Century, the history of college enrollments in the United States had been one of relatively consistent, but slow growth. The rate of growth increased slightly for the first half of the Twentieth-Century, before taking off like a rocket ship in the latter half of the Twentieth-Century. In the early years of the Twenty-First Century, the growth has sputtered and even dropped for several years. This is the context for the statement in the Education DIVE concerning falling enrollments. The article references the CNN report College enrollment is dropping. Bad sign?  This article begins by pointing out that college enrollment in the United States “peaked in 2010 at just over 21 million students. Attendance has dropped every year since. By the fall of 2014 — the most recent year that  government data is available from the Digest of Educational Statistics published by the National Center for Educational Statistics–there were 812,069 fewer students walking around college campuses.” Is this the first sign of trouble on the horizon? I think that it is a clear warning sign and should be taken very seriously by American IHEs.

However, the CNN article tries to assuage fears of impending doom by suggesting that this decline is primarily due to improvement in the economy. “More people are going back to work instead of signing up for additional degrees. ‘Historically, as the economy improves and Americans get back to work, college enrollment declines,’ says U.S. Under Secretary of Education Ted Mitchell.”  The unemployment rates from the Bureau of Labor Statistics lend some credence to this explanation, since the unemployment rate in 2010 was almost twice the unemployment in 2014. However, current federal and state administrations predict continued low unemployment rates, while predicting and pushing more students into higher education. Are IHEs and the federal and local governments trying to “have their cake and eat it too?”

Chart 1 below presents Total U.S. College Enrollments and Projections from 1870 to 2025. The data has been extracted from several sources including the report, 120 Years of American Education: A Statistical Portrait, published by the National Center for Educational Statistics (NCES), and the 2016 Digest of Educational Statistics also published by NCES. This graph gives the reader the sense of the enormity of the growth of American higher education in the last century compared to its early days.

Chart I Total U.S. College Enrollments from 1870 to 2025

However, because of the scale of the graph, it is difficult to get a perspective on some of the early growth of American higher education. Thus in Chart 2, I emphasize the growth of enrollment in the years 1870 to 1920.

Chart 2: U.S. College Enrollments from 1870 to 1920

Is the headline claim of enrollment doubling totally unreasonable? In the history of U.S. higher education, doubling of enrollment within one decade has never happened. The closest occurred from 1870, when the first doubling of enrollment took just over a decade. The next doubling of enrollments took approximately two decades. Looking at both Charts 1 and 2, we see that the next six doublings of enrollment took approximately 15 years each. Then in 1980, the brakes on enrollment growth began to slow down growth considerably. If there were to be another doubling of enrollment the NCES projections predict that it would take approximately five decades.

Evan Schofer and John W. Meyer in their paper The World-Wide Expansion of Higher Education in the Twentieth-Century  present some very startling results. They show that even though the higher education enrollments in the United States were expanding at what seemed to be break-neck speed in the last half of the Twentieth-Century, the United States’ share of the world’s higher education market fell from 50% to a meager 20%. With no apparent let-up in world-wide higher education enrollments, at least in the analysis of UNESCO and the independent scholars, Schofer and Meyer, it is a very small leap of faith to postulate that they could easily top 250 million by 2025. This would mean that the U.S. share of the world market falls to approximately 10%. The United States is no longer the top dog. The two countries of China and India have surpassed the U.S. share of the world market, with Europe, Africa and Latin America nipping at its heels.

I don’t believe that the future is much brighter for U.S. higher Education. This is especially true if U.S. colleges stick to their well-ingrained bias of focusing their offerings in a full-time, face-to-face format to late adolescents. This population has peaked in the United States and will be in decline over the next 20 years as the following chart from the U.S. Census Bureau indicates.

Enrollment peaked in 2011.  In July of 2011, there were about 18.1 million people in the prime college years of 18-21.  In June of 2014, that number was down to 17.4 million – nearly 700,000 fewer young people.  U.S. colleges enrolling 300,000 fewer students last year suddenly makes a lot of sense.  Not only are other options opening up for high school grads, but there are also just fewer warm bodies to go around.If we think about the graduating high school seniors who might be entering college, there would have been close to 4.6 million 18 year-olds in 2009.  Five years later, there were only 4.2 million – And the 17 year-olds preparing for college are the smallest age cohort younger than 35 – at 4,176,000.  The next set of them (current 16 year-olds) will be even smaller. In fact, we should expect a slowly declining pool of college-aged students for the foreseeable future, as illustrated by the graph below.

Data is extracted from the US Census and presented in an understandable format by Demographic Research Group at UVA

This has not been a very upbeat posting. My next post will attempt to analyze the problems and difficulties facing the U.S. higher education system. I will then propose some possible solutions. I can’t guarantee that the proposed solutions will work. In fact, the only thing that I can guarantee is that some of my readers will find these proposed solutions completely untenable.

Filed Under: Business and Economics, Higher Education, Leadership, Teaching and Learning Tagged With: College, Endrollment, World-WIde Share

August 3, 2016 By B. Baylis Leave a Comment

The Business Model of All of Higher Education is Broken — Part IV Tuition and Fees

from Presentation Media

This is the fourth part in a series on the economic conditions in higher education. The preceding post, The Business Model of All of Higher Education is Broken: Part III — Tuition and Fees, dealt with the history of the revenue stream generated by tuition and fees over the past 40 years. American higher education is divided into two main segments: public education and private education. Much of the American population has a giant misconception about how American higher education is funded. Most students and their families know full well the real financial burden that an education puts on their own budgets. However, it seems that many Americans believe that between government subsidies and the revenues generated by tuition and fees, both public and private colleges cover all of the educationally related  expenditures of these colleges. Most surveys suggest that the American population does not believe that American higher education is experiencing a real financial squeeze. On the other hand, surveys such as Inside Higher Ed’s Annual Survey of Chief Business Officers, tell a very different story. More college officials are starting to worry about the future of American higher education. While this debate rages, some current politicians are espousing the idea that the public institutions should be tuition free. Many independent analyses of this idea suggest that there are untold, hidden dangers in this bold plan. It looks like I just suggested the addition of at least two more posts to this series on The Business Model of All of Higher Education.

from Presentation Media

However, as promised this post will concentrate on the question of how much of college budgets are actually covered by students’ tuition and fees. The most recent compendium of cost data is from the January 2016 Delta Cost Project, at the American Institutes for Research (AIR), Trends in College Spending: 2003 – 2013.  This report is the most recent in a series of reports sponsored by the American Institutes for Research (AIR). These reports focused on two questions: 1) Revenues: Where Does the Money Come From? and 2) Expenditures: Where Does It Go? What Does It Buy?  In addition to the Delta Cost Project, expenditure data can be extracted from the Integrated Postsecondary Educational Data System (IPEDS) data base. Unfortunately, the Delta and IPEDS data do not segment their data in the same manner. In addition, the Delta study has not consistently used the same segmentation.

Data exacted from Delta Costs Studies and IPEDS data base; supplemented by author’s calculations

The Delta Study prior to 2013 used only six segments of institutions. There were three for public institutions: Research Universities, Master’s Universities, and Community Colleges. The three private categories were: Research Universities, Master’s Universities, and Bachelor’s Colleges. In 2013, the Delta Study added a seventh segment: Public Bachelor’s Colleges. In attempting to extract the data from the IPEDS data base, one must be careful because some college and university systems submitted data for individual institutions, while others submitted system-wide data. In using the IPEDS data for this post, I tried to break down data into seven segments. I can’t guarantee the absolute accuracy of all of my calculations. However, since the data seemed to fall in line with the Delta data, I am comfortable in using my data for general inferences.

There are at least four mysteries or questions that we can derive from the data in the chart above. The first is that the private institutions use more of tuition dollars to pay for Education and Related Costs (E&R Costs). This is not totally unexpected since public institutions by definition get more support from governmental sources. There is another question lurking in the weeds. The graph of E&R Costs for private institutions are much closer to flat lines than the more sharply increasing lines for public institutions. What are the causes of these sharp increases? Is this a subject for another post?

from Presenter Media

In terms of funding for Public Institutions of Higher Education (IHEs), federal and state politicians have been passing the football back and forth like a hot potato for the past quarter of a century. After many years of stability or growth, the percentage of total spending at state universities provided by state tax revenue has been sinking since 1990. In attempting to explain drastic increases in tuition and fees for Michigan residents, Jim Duderstadt, President of the University of Michigan from 1988 to 1996, told students, state legislators and the general public, “We used to be state-supported, then state-assisted, and now we are state-located.” In the Commonwealth of Pennsylvania, the State System of Higher Education is comprised of 14 “state owned” universities. The state contributes $3,900 annually per student while in-state students pay $10,052 annually in tuition and fees. For the state-supported, flagship institution Penn State University, in-state students pay $17,514 in tuition and fess while the state contributes $3,000.  Michigan and Pennsylvania are not the only two states that have “privatizing public higher education.” Thomas G. Mortenson began a Winter 2012 post, State Funding: A Race to the Bottom, on the American Council on Education (ACE) website on the Leadership and Advocacy page with the following statements:

State appropriations for public higher education have just faced another tough year. And yet, public institutions have faced many such years over the past three decades. Despite steadily growing student demand for higher education since the mid-1970s, state fiscal investment in higher education has been in retreat in the states since about 1980.

In fact, it is headed for zero.

Based on the trends since 1980, average state fiscal support for higher education will reach zero by 2059, although it could happen much sooner in some states and later in others.

I have one question for all the zealous politicians calling for tuition-free, or even debt-free public education: “Flying in the face of these current trends, where are you going to get the money to make up these differences?”  These conundrums sound like the material for additional posts.

from Presenter Media

The second question raised by the chart, Tuition’s Share of Education & Related Costs,  relates to the percentage of student tuition dollars that Private Master’s institutions devote to E&R Costs. These data help bring to light one of the most poorly kept secrets in higher education. Master’s programs can be cash cows for institutions. Traditionally, many master’s degree programs, such as MBA’s, MED’s, and MA’s in humanities, have not given out large amounts of financial aid to students. Master’s degree students in these areas come to the institutions without any expectation of financial aid from the institution, nor from current employers, if they have current employers. Thus, they tend to pay full tuition out of their own pockets, using loans to make up any differences they can’t fund out of their own savings and earnings. This frees up more money from the subsidy sources for institutions to use in other ways. Do these points provide us topics for additional posts?

The third question relates to three obvious declines in the percentage of student tuition dollars used to fund E&R Costs in the above data. The first two occurred in 2003 in the Private Research and Private Master’s universities. There are also drops in the Private Bachelor’s colleges and Public Master’s universities. These occurred in 2004 and 2006 respectively. This question has two parts. The first part is “Why did institutions decrease their dependence on student tuition dollars?” The second part is “Why did these declines occur at different times?”

The fourth mystery relates to the relative slope of the graphs of the public institutions. The Public Community Colleges have the slowest growth rate of all public institutions. Why have they been able to keep from dipping into the student tuition dollars to fund more of the E&R Costs? Do they know something or are they doing something different from the public four-year institutions?  Is this a topic for another post?

I believe that I have come to a good transition point in this discussion of Tuition and Fees providing additional funds for American colleges. If we can’t raise what each student pays, the next logical choice would be to get more students paying the base tuition and fees. The next post will deal with the problems of increasing the number of paying students going to college.


Filed Under: Business and Economics, Higher Education Tagged With: Budget, College, Economics, Subsidy, Tuition

July 18, 2016 By B. Baylis Leave a Comment

The Business Model of All of Higher Education Is Broken, Part III – Tuition and Fees

from Presenter Media

In this current post, I return to the discussion of the Business Model of All of Higher Education. In a previous post, The Business Model of All of Higher Education Is Broken,  I introduced the five sources of revenue for Institutions of Higher Educations(IHEs): 1) Tuition and fees; 2) Fundraising, advancement and development efforts; 3) Endowment income, appreciation, interest and dividends; 4) Auxiliary enterprises; and 5) Governmental appropriations. In this post, I had originally planned to consider all of those sources of revenue in one post. However as I began to work with that idea, I found the explanations growing too large for one post. In addition, no matter how hard I cranked the revenue generating machine for each revenue source in an attempt to create additional funds, I discovered that increasing the effort in any given area did not produce a commensurate return on investment (ROI). Therefore, I decided that I needed to expend more time and coverage in this series to each source of revenue to give it the analysis I felt it deserved.  Thus, I have decided that I will begin to plan to cover each of the revenue sources individually in separate posts. As I get into the ins and outs of the revenue source, I may have to add more posts. I begin this process with the source of revenue with which all students and their families are most familiar, Tuition and Fees . It is also the revenue source that the general public most clearly associates with Institutions of Higher Education (IHEs).

from Presenter Media

The revenue from tuition and fees obviously depends upon enrollment. This means that there are really only five ways to increase the useable revenue from tuition and fee. These five possibilities are:

  1. increase the tuition and fees, thus increasing the base amount each student pays;
  2. increase the number of students paying the tuition and fees, i.e, increase tuition-paying enrollment;
  3. decrease the discount rate on tuition, thus decreasing the average amount of institutional financial aid given to enrolled students;
  4. change the model of teaching and learning in order to increase the efficiency of the use of this revenue stream;
  5. do a combination of two or more of the above at the same time.

With points 3 and 4 above, I apologize for sneaking the expenditure side of the business model into the conversation. However, much of the general public acts as if it believes that tuition and fees cover the cost of a college education. This is definitely not the case, and has not been the case since the beginning of formal American higher education in the mid-17th century. Since this rabbit trail would take us deep into the expense side of the budgets of IHEs, I will leave the exploration of this topic to another post. I will devote the remainder of this post to just addressing the issue of increasing tuition and fees. I will cover the problems of increasing the number of students, decreasing the discount rate and changing the model of teaching and learning in additional posts.  I will also address the four other IHE revenue sources in additional posts.

from Presenter Media

When IHEs announce tuition increases each spring for the following fall, it is usually met with varying degrees of disdain. Students, parents, the general public, as well as federal and state governments are already enraged at the current level of tuition and fees. The data are clear. Tuition and fees have increased at rates exceeding the annual general inflation rate for years. Just at the suggestion of another increase, the reaction varies. It runs the gamut from a reluctant acceptance to a loud murmur to a campus uproar and rebellion.

The following three charts use the same data extracted from the College Board Pricing Trends, which has the most comprehensive collection of data on college pricing trends. Although the charts are based on the same data, they give us three different pictures of the history of Tuition and Fee Increases over the past 40 years. Why have I chosen to present this information in three ways? It is to try to help my readers understand that there are different ways to look at the same data and that one’s first impression may not be the only or best way to view the subject.

The first chart is a 40-year history of tuition and fee increases in “current  dollars,” i.e, the average list price of tuition and fees for all colleges in a given segment weighted by full-time undergraduate enrollment. These list prices are compared against the 40-year average increase in list prices. The current dollar tuition and fees are the prices that students, their parents, and government officials will see first. These are the dollar figures against which everyone reacts. The first impression from the graph is how similar the tuition and fees were for all three segments in 1975. Based on the scale of this graph, it is almost impossible to distinguish the price of the four-year, public institutions and the two-year, public institutions. Although the private, four-year institutions were more expensive, on the scale of this graph, in 1975 they did not appear “that much more expensive.”

CHART 1: History of Tuition and Fee Increases Compared Against 40-Year Average Annual Increases

The second impression that this graph conveys to me relates to how the actual increases fall below the projected increases based upon the 40-year average annual increase. This means that the early increases were less than the average annual increases and it took quite awhile for the actual increases to catch up with the average annual increases. It appears that the sharp increases in both public and private four-year schools occurred in the period from 2000 to 2010.  This would coincide with decreased support from government appropriations for financial aid.

This graph clearly gives the impression that the gap between the three segments has grown significantly. This is the feeling that students and their parents get when they start looking at colleges and the tuition prices. The fourth and fifth impressions that this graph gives me revolve around the two-year public institutions. The first of these impressions is how much more affordable this choice seems compared to the other two choices. The second impression is how close to a straight line the actual increases appear. To me, and many other commentators and critics of higher education,  this raises the spectre of whether these institutions “know the secret” for holding down tuition increases.

The two primary conclusions that many will draw from this graph are: 1) the two-year, public institutions are the most affordable choice for an education; and 2) the four-year, private institutions have had uncontrollable tuition increases over the past 40 years.

The second graph, entitled Growth Factors of Tuition and Fees from 1975 to 2015 Across College Segments, Selected Academic Years, portrays the same data that the first graph did, but gives a very different slant to that data. This chart tells us how fast tuition and fees grew. Surprisingly, it says that the time to double has been relatively constant. In rough terms throughout the 40 years from 1975 to 2015, it has generally taken 15 years for tuition in any of the college segments to double.

CHART 2: 40 Years of Tuition and Fee Growth Factors

SInce the blue bars representing the public, two-year institutions increase in height the most consistently, this is another verification of the steady, almost constant rate of growth of tuition and fees for the colleges in this segment. During the first 20 years, I find it very interesting to note that the public, two-year institutions increased their tuition and fees at the fastest rate, while public, four-year institutions at the slowest rate. In the second half of the 40-year period, the growth rate of public and private four-year institutions shot up, far out stripping the two-year public institutions. Does this represent a shift in public funding priorities for higher education?

Although the growth factors were very close since the private four-year institutions started out with higher tuition and fees, doubling the higher rate increased the differential. Thus, the actual dollar spread in tuition did indeed produce growth.Two different graphs give you two different pictures.

The third graph is entitled the Five-Year Percentage Changes in Tuition and Fees Across College Segments, From 1975 to 2015. This graph plots the percentage change in tuition and fees over five-year periods from 1975 to 2015. This graph gives one a very different picture of tuition and fee increases over these 40 years.  The overall trend of data points in this graph are actually decreasing. This doesn’t say that tuition and fees are decreasing. What it says is that the rate of change is slowing.

CHART 3: Five-Year Percentage Change in Tuitions and Fees, 1975 to 2015

Looking at the three different sets of points and lines joining those points, it is not surprising that the blue points representing the two-year, public institutions show the least variation. That confirms what we have seen in the other two graphs. The red points show the most variation away from a straight, decreasing line. The four-year, public institutions have been the institutions most affected by the whims of state legislatures or governors. Again, even though the rate of increase for private, four-year institutions is slowing down, don’t look for the public, four-year institutions to catch them in list price anytime in the near future.

Chart 1 hit me right between the eyes. To those who can remember, I challenge you to go back to your college days and put your tuition and fees into an appropriate year in the chart. For some of us we will have to add lines at the beginning of the chart. My experience would extend the chart another 10 years to the left. In the early sixties at the flagship university in a small state, I never paid more than $175.00 annual tuition plus $10 lab fees per science course, which usually added $20 or $30 per semester. Since computers were just coming into use, as a mathematics and physics major I had to pay a $25 per semester technology fee for the right to put my card decks in the hopper each night and come back the next morning to get the print out from the pin-fed line printer. In addition, as a commuter, I had to pay $50 per semester for a “hunting license” to try to find a parking space in an on-campus parking lot. Thus, my total annual tuition and fees bills were less than $550. My textbooks and supplies were less than $150 per semester. I lived at home, and my mother never charged me anything for room and board, because I took care of everything around the house since my father died during my freshmen year in college. Gasoline averaged about $0.30 per gallon, and I spent maybe $10.00 per week to keep my car in gas, and $25 per week for coffee and lunches. Thus, my total out-of-pocket expenses to go to college were less than $2000 per year, or $8000 for my entire undergraduate education. If you subtract the $6000 in scholarships that I won or was awarded, my B.S. degree in mathematics cost me less than $2000 out of pocket. Even in early 1960 dollars, that was entirely possible to pay for out of summer or part-time school year earnings. For my four years in graduate school, I had a fellowship that paid tuition and living expenses. I didn’t pay one nickel out of pocket for my Ph.D. I graduated in eight years of schooling, with a B.S. and a Ph.D.in mathematics, with a wife, a child, a house, two cars, money in the bank, NO DEBT, and an offer of a tenure track job! In today’s world that would be definitely an anomaly. According to CNN, for the most recent year for which data is available, the undergraduates of the class of 2013 walked off the commencement stage with an average debt of $35,200, while Ph.D. graduates “stumbled” off the platform with an average debt of $57,600. Among Ph.D.s, more than 28% had debts of more than $100,000. The average J.D. and M.D. graduating from Law School and Medical School respectively, had a debt of more than $140,000. Much has been written and debated about the debt bubble that has overtaken or is overtaking American higher education. It looks like I have created at least one more blog post on the Debt Bubble.

from Presenter Media

Why does this picture look so bleak? I believe it looks bleak because we could be on the verge of very bleak times for higher education. American higher education is heading for a perfect storm, unless it changes course or one or more components of the storm change direction. A perfect storm is the confluence of events which individually may not necessarily be dangerous, but the combination of these events creates a potentially disastrous situation. Here, too, I am taking you to the suspenseful edge, and leaving you to dangle. The perfect storm will be another post in this series on the broken business model of American Higher Education.

http://www.hamiltonproject.org/assets/legacy/images/uploads/thp_image_uploads/charts/college_cost_large.png#college%20cost%20chart%20520×520


Filed Under: Business and Economics, Higher Education, Politics Tagged With: Auxiliary Enterprises, Bubble, Business, Business Model, Debt, Economics, Endowment, Expenditure, Fundraising, Ministry, Return on Investment (ROI), Revenue, Service, Systemic Thinking, Tuition

July 4, 2016 By B. Baylis Leave a Comment

CHANGES AHEAD

from Presenter Media

There are some exciting happenings just around the bend for HEBB. I am reopening some of the previously closed operations of HEBB and rolling out some totally brand new ventures. Please stay tuned to the  HEBB website, and my blog  By’s Musings. for future updates on these events. You can subscribe to automatically receive those blog updates by giving us your email address in the box on the right side of this page. You have my word that your address will only be used for that purpose. We guarantee your privacy and will never sell or loan your address to someone else. Announcements of the updates will also be posted on Google+ (Bayard “By” Baylis), Twitter (@ByBaylis), and LinkedIn (Bayard Baylis),

from Presenter Media

If you can’t wait, I will give you some hints; but please don’t keep them to yourselves! Go and tell others. I really want everyone to know about these undertakings. HEBB will soon open its doors to accepting individual and family clients offering Biblical Life Planning counseling, along with individualized help on how to do college:  step-by-step guide on how to prepare for college; evaluate colleges; select the right college for you; complete college admissions and financial aid applications; successfully navigate the first-year of college; and make the most of your total college experience. I have also started writing books again, and am open to accepting certain speaking engagements, either in person or via electronic broadcasting.

from Presenter Media

I have recently started working on another project that I’m tentatively calling The Watershed Collaborative (TWC). It is intended to bring under one umbrella a diverse team of eminently qualified, highly-principled professionals with extensive experience from numerous fields of expertise, and from all segments of the public and private sectors, working collaboratively to help individuals and organizations identify and answer watershed questions. The mission of this proposed consulting alliance is to offer quality, values-based, comprehensive consulting and coaching services to educational institutions, ministries, non-profit organizations, and for-profit enterprises at reasonable prices. The membership of this alliance will consist of only partners who affirm the common goal of providing the highest quality information, advice and other services that are built on the foundation of solid theoretical research, and practical solutions which have been extensively tested in the work arena, uniquely fitted to the clients’ needs.

from Presenter Media

These are exciting times  for me and HEBB. I was never really sure that I would regain any semblance of the capabilities that I used to have. I wasn’t completely confident that I would be able to work again. This has long been a matter of prayer. Over the past three months, it has been wonderful to see God removing many obstacles. However, not by a stretch of anyone’s imagination am I ready to resume a full work schedule. However, much of my thought capabilities have returned, although I am still thinking visually and have to translate the pictures into words to communicate. My endurance is still a question mark. Most afternoons, I find myself in need of a nap to restore my energy.  After a short nap, I am ready to go again and can almost jump for joy.

from Presenter Media


Filed Under: Higher Education, Personal, Writing Tagged With: College, Family, Life Planning, Watershed, Writing

June 11, 2016 By B. Baylis Leave a Comment

Importance of Investing in Real Knowledge

Portrait of Benjamin Franklin, circa 1777 by Joseph Siffred Duplessis; image courtesy of Wikimedia Commons, in public domain

Benjamin Franklin reportedly said: “If a man empties his purse into his head, no man can take it away from him. An investment in knowledge always pays best interest.”  This particular quote emphasizes the importance for an individual to acquire knowledge at any price. In some ways it is analogous to Christ’s teaching from the sermon on the mount:

 Lay not up for yourselves treasures upon earth, where moth and rust doth corrupt, and where thieves break through and steal: But lay up for yourselves treasures in heaven, where neither moth nor rust doth corrupt, and where thieves do not break through nor steal: For where your treasure is, there will your heart be also. (Matthew 6: 19-21, KJV)

Both were teaching that there are things that are more valuable than material wealth. Whereas Christ was teaching the supremacy of spiritual things, Franklin raised the flag of intellectualism. However, it seems both teachings were lost on much of American culture for the first 150 years of this country’s existence. The predominant, driving force in the United States from 1776 until 1929 was materialism, the accumulation of wealth and material things.

Beginning in the 1930s, American society in general started transitioning from an industrial society to a new type of culture where value was based on technology, information and the use of information. Fritz Machlup was the first economist to popularize the term information society. Following in his foot steps, Peter Drucker was credited by BusinessWeek with the invention of the science of management. In 1966, he was the first author to give currency to the terms knowledge economy and knowledge worker.  A knowledge economy is an economy in which growth is dependent on the quantity, quality and accessibility of available information, rather than the means of production.

from Presenter Media

By the year 2000, the concept of the knowledge worker had  permeated all levels of all industries. Drucker can easily be seen as a disciple of Franklin…put your money in knowledge. In 2004, in Handbook of Business Strategy, Vol. 5 Iss: 1, George Elliott wrote: “Cognitive excellence: our people are our most important asset.” A year later, Baruch Lev, director of the Intangibles Research Project at New York University Stern School of Business, stated that “people are the most important asset of most companies.” Not only their knowledge, but the people themselves had become assets. This set off a firestorm of arguments. Are people to be treated like material resources?

However, in the 21st century, people are not the only intangible assets. In Lev’s earlier work, he demonstrated that in 1980, the total value of many international corporations was fully accounted for by their tangible assets. Today, he estimates that 80 percent of their value is tied up in intangible assets — brands, patents and trademarks. Note, that he didn’t mention people or intellectual property.  Franklin seems to be right. Investing in knowledge, both by individuals investing in their own knowledge and by corporations investing in their employees’ knowledge, pays off most handsomely.

I can’t argue with the main premise of Franklin’s maxim. However, I do think that today we take, and even Franklin in his day took too narrow a definition of knowledge. Franklin was placing his emphasis on “head” or content knowledge. I want to broaden the scope of knowledge to everything that can be an answer to the question, “What can I know?” How many different ways do we fill in the blank in the phrase, “I know ________.”

How many times have we said:

  1. “I know something.” This is the content knowledge of a subject matter. This is what many of our school teachers asked us to learn.
  2. “I know how to do something.” This is a skill that we learned or could do instinctively.
  3. “I know what I like.” These are the values that I hold dear.
  4. “I know myself.” This is personal knowledge that we generally believe that we don’t learn, but just know.
  5. “I know that person.” This is social or relational knowledge.” Sometimes this knowledge is very deep and intense. Other times this knowledge is superficial at best, and is said to be a “nodding acquaintance.”
  6. “I know God.” This is very personal and is on a different level from the material or physical world. This is spiritual or supernatural knowledge.

These six types of knowledge constitute whole or real knowledge. In another post I will more fully examine the six types of knowledge and how one can obtain such knowledge. In the meantime, like the television advertisement suggests, now is the time to start investing more in your future.


Filed Under: Faith and Religion, Higher Education, Personal, Teaching and Learning Tagged With: Content, God, Investment, Knowledge, Philosophy, Scripture, Skill, Truth, Value

  • « Go to Previous Page
  • Page 1
  • Interim pages omitted …
  • Page 5
  • Page 6
  • Page 7
  • Page 8
  • Page 9
  • Interim pages omitted …
  • Page 18
  • Go to Next Page »

Primary Sidebar

Search

Tags

Admissions Advent Alumni Aphasia Books Caregiver Christmas College Communication Community Activism Condition Disease Disorder Dysesthesia Economics Educational Modality Epilepsy Family Fundraising God Hallucinations Health Care History Humor Knowledge Learning Liberal Arts Love Metaphor Parkinson's Peace Philosophy Problem Solving Reading Recruitment Retention Scripture Student Technology Therapy Truth Verbal Thinking Visual Thinking Word Writing

Categories

  • Athletics
  • Business and Economics
  • Education
  • Faith and Religion
  • Food
  • Health
  • Higher Education
  • Humor
  • Leadership
  • Neurology
  • Neuroscience
  • Organizational Theory
  • Personal
  • Politics
  • Surviving
  • Teaching and Learning
  • Thriving
  • Uncategorized
  • Writing

Meta

  • Log in
  • Entries feed
  • Comments feed
  • WordPress.org
  • Home
  • Blog
  • Overview

Copyright © 2010–2025 Higher Ed By Baylis