• Skip to primary navigation
  • Skip to main content
  • Skip to primary sidebar

By's Musings

  • Home
  • Blog
  • Overview

September 6, 2016 By B. Baylis Leave a Comment

Four Lessons from Five Verses: Lesson III-Part A

Structural diagram of II Timothy 2:2, created by author using ClickCharts Professional

I took my Memorial Day and Independence Day Posts from the first five verses of chapter 2 of Paul’s second letter to his protege Timothy. One focused on the attributes of a good soldier, while the second looked at how to be a winner. I didn’t plan this series of posts to be a holiday series. However, the first two coincided with Memorial Day and Independence Day. This post coincides with Labor Day, which may be very appropriate, as verse 2 opens the door for us to look at the office, qualifications and work of a teacher. It also opens the door for us to look at much more than we can cover in one post. Thus, this post will become a wormhole for us to investigate more fascinating topics dealing with the process and responsibilities of teachers, and the cyclic, self-sustaining patterns of biblical teaching.

It seems very appropriate to look at teaching this Labor Day, since many have declared teaching to be a labor of love. The dictionary definition of a labor of love is work “done as an end onto itself, rather than a means to an end. It is work that benefits others rather than significantly rewarding the laborer materially.” In Paul’s case, it was definitely a labor of love. He did it out of his love of his Savior, the Lord Jesus Christ. Paul also did it for the heavenly reward or benefit that others might receive.

Love is central to all of Christian theology. We love God because He first loved us (I John 4:19). In fact, God loved us so much that he sent His Son to die for us and be a propitiation for our sins. (I John 4:10). Propitation is a big word that means “turning away one’s wrath.” Christ’s sacrifice on the cross satisfied the demands of a righteous God, turning away his wrath against our sin. As demonstrated in I John, the Apostle John could be called the disciple of love. In his gospel, after Mary Magdalene discovered the empty tomb, she ran to Peter and “to the other disciple, whom Jesus loved.”

courtesy of Presenter Media

However, love is just as central to Paul’s view of theology, as it was for John. In Romans 5:8, Paul wrote, “But God commendeth his love toward us, in that, while we were yet sinners, Christ died for us.”  In his first letter to the Christians in Corinth, Paul wrote what’s known as the Love Chapter. He begins Chapter 13, with these words “Though I speak with the tongues of men and of angels, and have not charity, I am become as sounding brass, or a tinkling cymbal.” and ends it with “And now abideth faith, hope, charity, these three; but the greatest of these is charity,”  The word  translated “charity ” could just as easily have been translated “love.” Without love, there is no harmony, only discord. 

We are to love as Christ loved. However, our love doesn’t originate in us. We can’t generate our own love. It is a reflection of God’s love, as Paul wrote in Ephesians 5:1-2, “Be ye therefore followers [imitators] of God, as dear [beloved] children; and walk in love, as Christ also hath loved us, and gave himself up for us, an offering and a sacrifice to God for a sweet smelling savour.”  The Ephesian 5 passage is not the only time Paul talked about imitating Christ. Paul begins Chapter 11 of I Corinthians with these words, “Be ye followers of me, even as I also am of Christ.” Do you see the repetitive pattern starting to form? Follow Paul, as Paul followed Christ. Teach others to follow you, as you follow Christ.

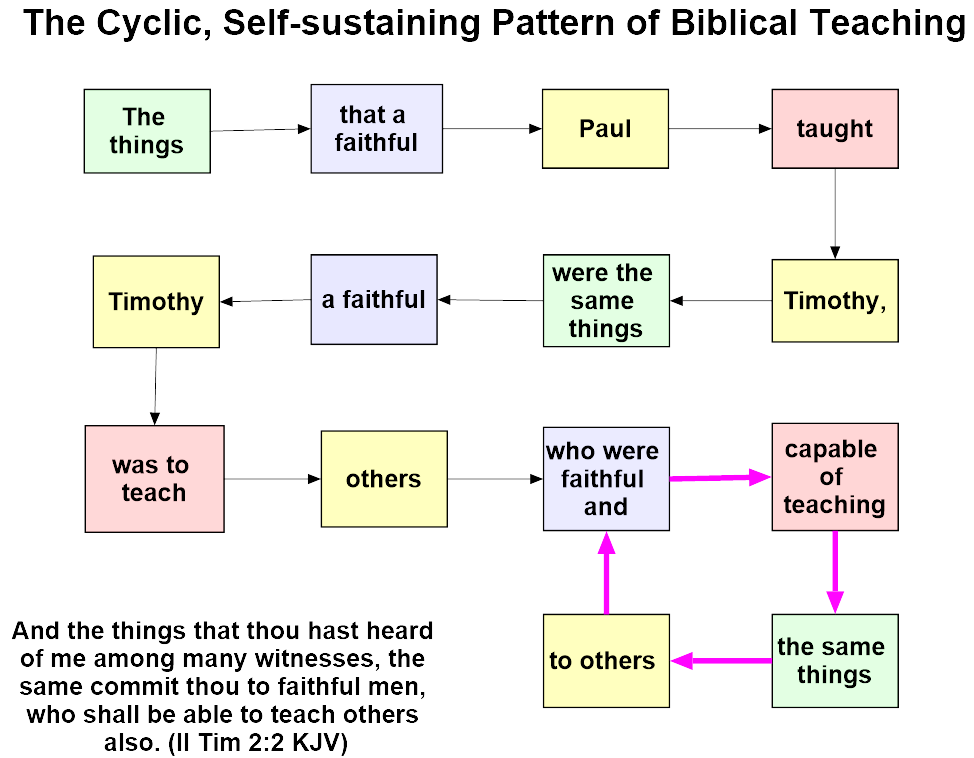
So just as Christ taught his disciples how to love God, Paul is teaching Timothy “the same things.”  So what is Timothy to do? He is to find faithful men, capable of teaching others, these “same things.”  It is the cyclic, repetitive, self-sustaining pattern of Biblical teaching. It is a labor of love.


Filed Under: Faith and Religion, Personal, Teaching and Learning Tagged With: God, Love, Scripture

August 24, 2016 By B. Baylis Leave a Comment

The Business Model of All of Higher Education Is Broken–Part V Increasing Enrollments Is Not Enough

For some in American higher education, the headline College enrollments to double in next decade that appeared in the July 12, 2016, edition of Education DIVE, a daily online newsletter of news from all aspects of education, may have seemed like the message from on high that they desperately wanted to see and hear. However, if American Institutions of Higher Education (IHEs) are counting on this touted coming influx of students for the future health of their institutions, they are going to be sadly mistaken.

This installment is the fifth part in a series on the economic conditions in American higher education. The preceding installment, The Business Model of All of Higher Education is Broken: Part IV — Tuition and Fees, dealt with the general trend of increasing the share that tuition must cover of an institution’s  Education and Related Costs (E & R Costs). However, in The Business Model of All of Higher Education is Broken: Part III — Tuition and Fees, we saw that students and their families are resisting any and all suggestions that increasing individual students’ tuition and fees should provide a possible solution to higher education’s financial difficulties. Students and families are saying, “Enough is enough! We’ve paid our fair share!” This thought is only reinforced by politicians saying that four years of public college education should be free for every one or at least the overwhelming majority of the American public. This means that to realistically get more money out of the Tuition & Fees Bucket, institutions must increase the number of students paying the current or possibly even lower tuition charges. If institutions are counting on many new students saving them from financial disaster, there are several significant holes in this strategy.

from Presenter Media

In spite of the bold headline, the first hole in this strategy is what I believe is the mistaken belief of many leaders in the American higher education megaplex that there is a seemingly unending and ever expanding supply of students who will pay any price to be part of the American higher education scene. The preceding post in this series presented some of the arguments against raising tuition. Two recent articles in education press circles clearly show the strategy of counting on continuously growing enrollments may soon blow up in the face of traditional IHEs. While the Education DIVE headline  appears to bolster the claim that there is a growing supply of fresh bodies for American IHEs, it conveniently omitted the fact that the article was referring to “the number of students in colleges and universities across the globe will double by 2025.”  As you read the article, it does admit that enrollments at U.S. colleges are falling. Are they trying to rain on the parade of educational expansionists?

In the Nineteenth Century, the history of college enrollments in the United States had been one of relatively consistent, but slow growth. The rate of growth increased slightly for the first half of the Twentieth-Century, before taking off like a rocket ship in the latter half of the Twentieth-Century. In the early years of the Twenty-First Century, the growth has sputtered and even dropped for several years. This is the context for the statement in the Education DIVE concerning falling enrollments. The article references the CNN report College enrollment is dropping. Bad sign?  This article begins by pointing out that college enrollment in the United States “peaked in 2010 at just over 21 million students. Attendance has dropped every year since. By the fall of 2014 — the most recent year that  government data is available from the Digest of Educational Statistics published by the National Center for Educational Statistics–there were 812,069 fewer students walking around college campuses.” Is this the first sign of trouble on the horizon? I think that it is a clear warning sign and should be taken very seriously by American IHEs.

However, the CNN article tries to assuage fears of impending doom by suggesting that this decline is primarily due to improvement in the economy. “More people are going back to work instead of signing up for additional degrees. ‘Historically, as the economy improves and Americans get back to work, college enrollment declines,’ says U.S. Under Secretary of Education Ted Mitchell.”  The unemployment rates from the Bureau of Labor Statistics lend some credence to this explanation, since the unemployment rate in 2010 was almost twice the unemployment in 2014. However, current federal and state administrations predict continued low unemployment rates, while predicting and pushing more students into higher education. Are IHEs and the federal and local governments trying to “have their cake and eat it too?”

Chart 1 below presents Total U.S. College Enrollments and Projections from 1870 to 2025. The data has been extracted from several sources including the report, 120 Years of American Education: A Statistical Portrait, published by the National Center for Educational Statistics (NCES), and the 2016 Digest of Educational Statistics also published by NCES. This graph gives the reader the sense of the enormity of the growth of American higher education in the last century compared to its early days.

Chart I Total U.S. College Enrollments from 1870 to 2025

However, because of the scale of the graph, it is difficult to get a perspective on some of the early growth of American higher education. Thus in Chart 2, I emphasize the growth of enrollment in the years 1870 to 1920.

Chart 2: U.S. College Enrollments from 1870 to 1920

Is the headline claim of enrollment doubling totally unreasonable? In the history of U.S. higher education, doubling of enrollment within one decade has never happened. The closest occurred from 1870, when the first doubling of enrollment took just over a decade. The next doubling of enrollments took approximately two decades. Looking at both Charts 1 and 2, we see that the next six doublings of enrollment took approximately 15 years each. Then in 1980, the brakes on enrollment growth began to slow down growth considerably. If there were to be another doubling of enrollment the NCES projections predict that it would take approximately five decades.

Evan Schofer and John W. Meyer in their paper The World-Wide Expansion of Higher Education in the Twentieth-Century  present some very startling results. They show that even though the higher education enrollments in the United States were expanding at what seemed to be break-neck speed in the last half of the Twentieth-Century, the United States’ share of the world’s higher education market fell from 50% to a meager 20%. With no apparent let-up in world-wide higher education enrollments, at least in the analysis of UNESCO and the independent scholars, Schofer and Meyer, it is a very small leap of faith to postulate that they could easily top 250 million by 2025. This would mean that the U.S. share of the world market falls to approximately 10%. The United States is no longer the top dog. The two countries of China and India have surpassed the U.S. share of the world market, with Europe, Africa and Latin America nipping at its heels.

I don’t believe that the future is much brighter for U.S. higher Education. This is especially true if U.S. colleges stick to their well-ingrained bias of focusing their offerings in a full-time, face-to-face format to late adolescents. This population has peaked in the United States and will be in decline over the next 20 years as the following chart from the U.S. Census Bureau indicates.

Enrollment peaked in 2011.  In July of 2011, there were about 18.1 million people in the prime college years of 18-21.  In June of 2014, that number was down to 17.4 million – nearly 700,000 fewer young people.  U.S. colleges enrolling 300,000 fewer students last year suddenly makes a lot of sense.  Not only are other options opening up for high school grads, but there are also just fewer warm bodies to go around.If we think about the graduating high school seniors who might be entering college, there would have been close to 4.6 million 18 year-olds in 2009.  Five years later, there were only 4.2 million – And the 17 year-olds preparing for college are the smallest age cohort younger than 35 – at 4,176,000.  The next set of them (current 16 year-olds) will be even smaller. In fact, we should expect a slowly declining pool of college-aged students for the foreseeable future, as illustrated by the graph below.

Data is extracted from the US Census and presented in an understandable format by Demographic Research Group at UVA

This has not been a very upbeat posting. My next post will attempt to analyze the problems and difficulties facing the U.S. higher education system. I will then propose some possible solutions. I can’t guarantee that the proposed solutions will work. In fact, the only thing that I can guarantee is that some of my readers will find these proposed solutions completely untenable.

Filed Under: Business and Economics, Higher Education, Leadership, Teaching and Learning Tagged With: College, Endrollment, World-WIde Share

August 3, 2016 By B. Baylis Leave a Comment

The Business Model of All of Higher Education is Broken — Part IV Tuition and Fees

from Presentation Media

This is the fourth part in a series on the economic conditions in higher education. The preceding post, The Business Model of All of Higher Education is Broken: Part III — Tuition and Fees, dealt with the history of the revenue stream generated by tuition and fees over the past 40 years. American higher education is divided into two main segments: public education and private education. Much of the American population has a giant misconception about how American higher education is funded. Most students and their families know full well the real financial burden that an education puts on their own budgets. However, it seems that many Americans believe that between government subsidies and the revenues generated by tuition and fees, both public and private colleges cover all of the educationally related  expenditures of these colleges. Most surveys suggest that the American population does not believe that American higher education is experiencing a real financial squeeze. On the other hand, surveys such as Inside Higher Ed’s Annual Survey of Chief Business Officers, tell a very different story. More college officials are starting to worry about the future of American higher education. While this debate rages, some current politicians are espousing the idea that the public institutions should be tuition free. Many independent analyses of this idea suggest that there are untold, hidden dangers in this bold plan. It looks like I just suggested the addition of at least two more posts to this series on The Business Model of All of Higher Education.

from Presentation Media

However, as promised this post will concentrate on the question of how much of college budgets are actually covered by students’ tuition and fees. The most recent compendium of cost data is from the January 2016 Delta Cost Project, at the American Institutes for Research (AIR), Trends in College Spending: 2003 – 2013.  This report is the most recent in a series of reports sponsored by the American Institutes for Research (AIR). These reports focused on two questions: 1) Revenues: Where Does the Money Come From? and 2) Expenditures: Where Does It Go? What Does It Buy?  In addition to the Delta Cost Project, expenditure data can be extracted from the Integrated Postsecondary Educational Data System (IPEDS) data base. Unfortunately, the Delta and IPEDS data do not segment their data in the same manner. In addition, the Delta study has not consistently used the same segmentation.

Data exacted from Delta Costs Studies and IPEDS data base; supplemented by author’s calculations

The Delta Study prior to 2013 used only six segments of institutions. There were three for public institutions: Research Universities, Master’s Universities, and Community Colleges. The three private categories were: Research Universities, Master’s Universities, and Bachelor’s Colleges. In 2013, the Delta Study added a seventh segment: Public Bachelor’s Colleges. In attempting to extract the data from the IPEDS data base, one must be careful because some college and university systems submitted data for individual institutions, while others submitted system-wide data. In using the IPEDS data for this post, I tried to break down data into seven segments. I can’t guarantee the absolute accuracy of all of my calculations. However, since the data seemed to fall in line with the Delta data, I am comfortable in using my data for general inferences.

There are at least four mysteries or questions that we can derive from the data in the chart above. The first is that the private institutions use more of tuition dollars to pay for Education and Related Costs (E&R Costs). This is not totally unexpected since public institutions by definition get more support from governmental sources. There is another question lurking in the weeds. The graph of E&R Costs for private institutions are much closer to flat lines than the more sharply increasing lines for public institutions. What are the causes of these sharp increases? Is this a subject for another post?

from Presenter Media

In terms of funding for Public Institutions of Higher Education (IHEs), federal and state politicians have been passing the football back and forth like a hot potato for the past quarter of a century. After many years of stability or growth, the percentage of total spending at state universities provided by state tax revenue has been sinking since 1990. In attempting to explain drastic increases in tuition and fees for Michigan residents, Jim Duderstadt, President of the University of Michigan from 1988 to 1996, told students, state legislators and the general public, “We used to be state-supported, then state-assisted, and now we are state-located.” In the Commonwealth of Pennsylvania, the State System of Higher Education is comprised of 14 “state owned” universities. The state contributes $3,900 annually per student while in-state students pay $10,052 annually in tuition and fees. For the state-supported, flagship institution Penn State University, in-state students pay $17,514 in tuition and fess while the state contributes $3,000.  Michigan and Pennsylvania are not the only two states that have “privatizing public higher education.” Thomas G. Mortenson began a Winter 2012 post, State Funding: A Race to the Bottom, on the American Council on Education (ACE) website on the Leadership and Advocacy page with the following statements:

State appropriations for public higher education have just faced another tough year. And yet, public institutions have faced many such years over the past three decades. Despite steadily growing student demand for higher education since the mid-1970s, state fiscal investment in higher education has been in retreat in the states since about 1980.

In fact, it is headed for zero.

Based on the trends since 1980, average state fiscal support for higher education will reach zero by 2059, although it could happen much sooner in some states and later in others.

I have one question for all the zealous politicians calling for tuition-free, or even debt-free public education: “Flying in the face of these current trends, where are you going to get the money to make up these differences?”  These conundrums sound like the material for additional posts.

from Presenter Media

The second question raised by the chart, Tuition’s Share of Education & Related Costs,  relates to the percentage of student tuition dollars that Private Master’s institutions devote to E&R Costs. These data help bring to light one of the most poorly kept secrets in higher education. Master’s programs can be cash cows for institutions. Traditionally, many master’s degree programs, such as MBA’s, MED’s, and MA’s in humanities, have not given out large amounts of financial aid to students. Master’s degree students in these areas come to the institutions without any expectation of financial aid from the institution, nor from current employers, if they have current employers. Thus, they tend to pay full tuition out of their own pockets, using loans to make up any differences they can’t fund out of their own savings and earnings. This frees up more money from the subsidy sources for institutions to use in other ways. Do these points provide us topics for additional posts?

The third question relates to three obvious declines in the percentage of student tuition dollars used to fund E&R Costs in the above data. The first two occurred in 2003 in the Private Research and Private Master’s universities. There are also drops in the Private Bachelor’s colleges and Public Master’s universities. These occurred in 2004 and 2006 respectively. This question has two parts. The first part is “Why did institutions decrease their dependence on student tuition dollars?” The second part is “Why did these declines occur at different times?”

The fourth mystery relates to the relative slope of the graphs of the public institutions. The Public Community Colleges have the slowest growth rate of all public institutions. Why have they been able to keep from dipping into the student tuition dollars to fund more of the E&R Costs? Do they know something or are they doing something different from the public four-year institutions?  Is this a topic for another post?

I believe that I have come to a good transition point in this discussion of Tuition and Fees providing additional funds for American colleges. If we can’t raise what each student pays, the next logical choice would be to get more students paying the base tuition and fees. The next post will deal with the problems of increasing the number of paying students going to college.


Filed Under: Business and Economics, Higher Education Tagged With: Budget, College, Economics, Subsidy, Tuition

July 18, 2016 By B. Baylis Leave a Comment

The Business Model of All of Higher Education Is Broken, Part III – Tuition and Fees

from Presenter Media

In this current post, I return to the discussion of the Business Model of All of Higher Education. In a previous post, The Business Model of All of Higher Education Is Broken,  I introduced the five sources of revenue for Institutions of Higher Educations(IHEs): 1) Tuition and fees; 2) Fundraising, advancement and development efforts; 3) Endowment income, appreciation, interest and dividends; 4) Auxiliary enterprises; and 5) Governmental appropriations. In this post, I had originally planned to consider all of those sources of revenue in one post. However as I began to work with that idea, I found the explanations growing too large for one post. In addition, no matter how hard I cranked the revenue generating machine for each revenue source in an attempt to create additional funds, I discovered that increasing the effort in any given area did not produce a commensurate return on investment (ROI). Therefore, I decided that I needed to expend more time and coverage in this series to each source of revenue to give it the analysis I felt it deserved.  Thus, I have decided that I will begin to plan to cover each of the revenue sources individually in separate posts. As I get into the ins and outs of the revenue source, I may have to add more posts. I begin this process with the source of revenue with which all students and their families are most familiar, Tuition and Fees . It is also the revenue source that the general public most clearly associates with Institutions of Higher Education (IHEs).

from Presenter Media

The revenue from tuition and fees obviously depends upon enrollment. This means that there are really only five ways to increase the useable revenue from tuition and fee. These five possibilities are:

  1. increase the tuition and fees, thus increasing the base amount each student pays;
  2. increase the number of students paying the tuition and fees, i.e, increase tuition-paying enrollment;
  3. decrease the discount rate on tuition, thus decreasing the average amount of institutional financial aid given to enrolled students;
  4. change the model of teaching and learning in order to increase the efficiency of the use of this revenue stream;
  5. do a combination of two or more of the above at the same time.

With points 3 and 4 above, I apologize for sneaking the expenditure side of the business model into the conversation. However, much of the general public acts as if it believes that tuition and fees cover the cost of a college education. This is definitely not the case, and has not been the case since the beginning of formal American higher education in the mid-17th century. Since this rabbit trail would take us deep into the expense side of the budgets of IHEs, I will leave the exploration of this topic to another post. I will devote the remainder of this post to just addressing the issue of increasing tuition and fees. I will cover the problems of increasing the number of students, decreasing the discount rate and changing the model of teaching and learning in additional posts.  I will also address the four other IHE revenue sources in additional posts.

from Presenter Media

When IHEs announce tuition increases each spring for the following fall, it is usually met with varying degrees of disdain. Students, parents, the general public, as well as federal and state governments are already enraged at the current level of tuition and fees. The data are clear. Tuition and fees have increased at rates exceeding the annual general inflation rate for years. Just at the suggestion of another increase, the reaction varies. It runs the gamut from a reluctant acceptance to a loud murmur to a campus uproar and rebellion.

The following three charts use the same data extracted from the College Board Pricing Trends, which has the most comprehensive collection of data on college pricing trends. Although the charts are based on the same data, they give us three different pictures of the history of Tuition and Fee Increases over the past 40 years. Why have I chosen to present this information in three ways? It is to try to help my readers understand that there are different ways to look at the same data and that one’s first impression may not be the only or best way to view the subject.

The first chart is a 40-year history of tuition and fee increases in “current  dollars,” i.e, the average list price of tuition and fees for all colleges in a given segment weighted by full-time undergraduate enrollment. These list prices are compared against the 40-year average increase in list prices. The current dollar tuition and fees are the prices that students, their parents, and government officials will see first. These are the dollar figures against which everyone reacts. The first impression from the graph is how similar the tuition and fees were for all three segments in 1975. Based on the scale of this graph, it is almost impossible to distinguish the price of the four-year, public institutions and the two-year, public institutions. Although the private, four-year institutions were more expensive, on the scale of this graph, in 1975 they did not appear “that much more expensive.”

CHART 1: History of Tuition and Fee Increases Compared Against 40-Year Average Annual Increases

The second impression that this graph conveys to me relates to how the actual increases fall below the projected increases based upon the 40-year average annual increase. This means that the early increases were less than the average annual increases and it took quite awhile for the actual increases to catch up with the average annual increases. It appears that the sharp increases in both public and private four-year schools occurred in the period from 2000 to 2010.  This would coincide with decreased support from government appropriations for financial aid.

This graph clearly gives the impression that the gap between the three segments has grown significantly. This is the feeling that students and their parents get when they start looking at colleges and the tuition prices. The fourth and fifth impressions that this graph gives me revolve around the two-year public institutions. The first of these impressions is how much more affordable this choice seems compared to the other two choices. The second impression is how close to a straight line the actual increases appear. To me, and many other commentators and critics of higher education,  this raises the spectre of whether these institutions “know the secret” for holding down tuition increases.

The two primary conclusions that many will draw from this graph are: 1) the two-year, public institutions are the most affordable choice for an education; and 2) the four-year, private institutions have had uncontrollable tuition increases over the past 40 years.

The second graph, entitled Growth Factors of Tuition and Fees from 1975 to 2015 Across College Segments, Selected Academic Years, portrays the same data that the first graph did, but gives a very different slant to that data. This chart tells us how fast tuition and fees grew. Surprisingly, it says that the time to double has been relatively constant. In rough terms throughout the 40 years from 1975 to 2015, it has generally taken 15 years for tuition in any of the college segments to double.

CHART 2: 40 Years of Tuition and Fee Growth Factors

SInce the blue bars representing the public, two-year institutions increase in height the most consistently, this is another verification of the steady, almost constant rate of growth of tuition and fees for the colleges in this segment. During the first 20 years, I find it very interesting to note that the public, two-year institutions increased their tuition and fees at the fastest rate, while public, four-year institutions at the slowest rate. In the second half of the 40-year period, the growth rate of public and private four-year institutions shot up, far out stripping the two-year public institutions. Does this represent a shift in public funding priorities for higher education?

Although the growth factors were very close since the private four-year institutions started out with higher tuition and fees, doubling the higher rate increased the differential. Thus, the actual dollar spread in tuition did indeed produce growth.Two different graphs give you two different pictures.

The third graph is entitled the Five-Year Percentage Changes in Tuition and Fees Across College Segments, From 1975 to 2015. This graph plots the percentage change in tuition and fees over five-year periods from 1975 to 2015. This graph gives one a very different picture of tuition and fee increases over these 40 years.  The overall trend of data points in this graph are actually decreasing. This doesn’t say that tuition and fees are decreasing. What it says is that the rate of change is slowing.

CHART 3: Five-Year Percentage Change in Tuitions and Fees, 1975 to 2015

Looking at the three different sets of points and lines joining those points, it is not surprising that the blue points representing the two-year, public institutions show the least variation. That confirms what we have seen in the other two graphs. The red points show the most variation away from a straight, decreasing line. The four-year, public institutions have been the institutions most affected by the whims of state legislatures or governors. Again, even though the rate of increase for private, four-year institutions is slowing down, don’t look for the public, four-year institutions to catch them in list price anytime in the near future.

Chart 1 hit me right between the eyes. To those who can remember, I challenge you to go back to your college days and put your tuition and fees into an appropriate year in the chart. For some of us we will have to add lines at the beginning of the chart. My experience would extend the chart another 10 years to the left. In the early sixties at the flagship university in a small state, I never paid more than $175.00 annual tuition plus $10 lab fees per science course, which usually added $20 or $30 per semester. Since computers were just coming into use, as a mathematics and physics major I had to pay a $25 per semester technology fee for the right to put my card decks in the hopper each night and come back the next morning to get the print out from the pin-fed line printer. In addition, as a commuter, I had to pay $50 per semester for a “hunting license” to try to find a parking space in an on-campus parking lot. Thus, my total annual tuition and fees bills were less than $550. My textbooks and supplies were less than $150 per semester. I lived at home, and my mother never charged me anything for room and board, because I took care of everything around the house since my father died during my freshmen year in college. Gasoline averaged about $0.30 per gallon, and I spent maybe $10.00 per week to keep my car in gas, and $25 per week for coffee and lunches. Thus, my total out-of-pocket expenses to go to college were less than $2000 per year, or $8000 for my entire undergraduate education. If you subtract the $6000 in scholarships that I won or was awarded, my B.S. degree in mathematics cost me less than $2000 out of pocket. Even in early 1960 dollars, that was entirely possible to pay for out of summer or part-time school year earnings. For my four years in graduate school, I had a fellowship that paid tuition and living expenses. I didn’t pay one nickel out of pocket for my Ph.D. I graduated in eight years of schooling, with a B.S. and a Ph.D.in mathematics, with a wife, a child, a house, two cars, money in the bank, NO DEBT, and an offer of a tenure track job! In today’s world that would be definitely an anomaly. According to CNN, for the most recent year for which data is available, the undergraduates of the class of 2013 walked off the commencement stage with an average debt of $35,200, while Ph.D. graduates “stumbled” off the platform with an average debt of $57,600. Among Ph.D.s, more than 28% had debts of more than $100,000. The average J.D. and M.D. graduating from Law School and Medical School respectively, had a debt of more than $140,000. Much has been written and debated about the debt bubble that has overtaken or is overtaking American higher education. It looks like I have created at least one more blog post on the Debt Bubble.

from Presenter Media

Why does this picture look so bleak? I believe it looks bleak because we could be on the verge of very bleak times for higher education. American higher education is heading for a perfect storm, unless it changes course or one or more components of the storm change direction. A perfect storm is the confluence of events which individually may not necessarily be dangerous, but the combination of these events creates a potentially disastrous situation. Here, too, I am taking you to the suspenseful edge, and leaving you to dangle. The perfect storm will be another post in this series on the broken business model of American Higher Education.

http://www.hamiltonproject.org/assets/legacy/images/uploads/thp_image_uploads/charts/college_cost_large.png#college%20cost%20chart%20520×520


Filed Under: Business and Economics, Higher Education, Politics Tagged With: Auxiliary Enterprises, Bubble, Business, Business Model, Debt, Economics, Endowment, Expenditure, Fundraising, Ministry, Return on Investment (ROI), Revenue, Service, Systemic Thinking, Tuition

July 9, 2016 By B. Baylis Leave a Comment

Four Lessons from FIve Verses – Part II

My Memorial Day Post, Four Lessons from FIve Verses was inspired by the Memorial Day message at Calvary Baptist Church in York, Pennsylvania by our senior pastor, Reverend Greg Wahlberg. The scripture reading for the day was taken from II Timothy, chapter 2. I return to this passage for my Independence Day post (a little late).

Thou therefore, my son, be strong in the grace that is in Christ Jesus. And the things that thou hast heard of me among many witnesses, the same commit thou to faithful men, who shall be able to teach others also. Thou therefore endure hardness, as a good soldier of Jesus Christ. No man that warreth entangleth himself with the affairs of this life; that he may please him who hath chosen him to be a soldier.  And if a man also strive for masteries, yet is he not crowned, except he strive lawfully. (II Timothy 2:1-5, KJV) 

The author of Psalm 33 is not definitively known. It falls between two Psalms of David, and carries on a thought directly from the end of Psalm 32. Therefore, it may be a Psalm of David; Image courtesy of Graphics Stock

In the previously mentioned post, I concentrated on the lesson of being a good soldier from verses 3 and 4. In this post I move on to verse 5, “And if a man also strive for masteries, yet is he not crowned, except he strive lawfully. ” to look at the lesson of winning by the rules. As God would have it, the call to worship was Psalm 33:12. In addition, the Independence Day message. delivered by our Associate Pastor, Rev Richard Hall, was about winning and losing.  The scripture lesson came from the Old Testament story of Jacob wrestling God. 

Image courtesy of clker.com; Shared by Ruthie

 And Jacob was left alone; and there wrestled a man with him until the breaking of the day. And when he saw that he prevailed not against him, he touched the hollow of his thigh; and the hollow of Jacob’s thigh was out of joint, as he wrestled with him.  And he said, Let me go, for the day breaketh. And he said, I will not let thee go, except thou bless me. And he said unto him, What is thy name? And he said, Jacob. And he said, Thy name shall be called no more Jacob, but Israel: for as a prince hast thou power with God and with men, and hast prevailed. And Jacob asked him, and said, Tell me, I pray thee, thy name. And he said, Wherefore is it that thou dost ask after my name? And he blessed him there. And Jacob called the name of the place Peniel: for I have seen God face to face, and my life is preserved.  (Genesis 32: 24-30, KJV)

from Presenter Media

I am an extremely competitive person, and I love to win. VInce Lombardi, venerable coach of the Green Bay Packers says his famous quote “Winning isn’t everything; it is the only thing.” was misquoted. He claims to have said, “Winning isn’t everything, the will to win is the only thing.” More than 50 years of playing baseball, softball and basketball taught me the truth of the second quote very well. Scripture also teaches us that winning is for winners. Paul writing to the Corinthians says:

 Know ye not that they which run in a race run all, but one receiveth the prize? So run, that ye may obtain.  And every man that striveth for the mastery is temperate in all things. Now they do it to obtain a corruptible crown; but we an incorruptible. I therefore so run, not as uncertainly; so fight I, not as one that beateth the air:  But I keep under my body, and bring it into subjection: lest that by any means, when I have preached to others, I myself should be a castaway. (I Corinthians 9: 24-27, KJV)

However, winning at all costs is not an option. Paul, writing to his protege Timothy in the text for today’s post, puts winning in its proper context:  And if a man also strive for masteries, yet is he not crowned, except he strive lawfully. (II Timothy 2:5, KJV)

Nevertheless, we have all seen cheaters prosper and the righteous suffer. Two Old Testament writers describe this experience far better than I could ever do. The author of Psalm 73 (usually attributed to Asaph, but some modern scholars date this Psalm to the post-exile and Second Temple period, ruling out Asaph, who served David) eloquently laments this perplexing situation:

For I was envious at the foolish, when I saw the prosperity of the wicked. For there are no bands in their death: but their strength is firm. They are not in trouble as other men; neither are they plagued like other men. Therefore pride compasseth them about as a chain; violence covereth them as a garment. Their eyes stand out with fatness: they have more than heart could wish. They are corrupt, and speak wickedly concerning oppression: they speak loftily. They set their mouth against the heavens, and their tongue walketh through the earth. Therefore his people return hither: and waters of a full cup are wrung out to them.  And they say, How doth God know? and is there knowledge in the most High? Behold, these are the ungodly, who prosper in the world; they increase in riches. Verily I have cleansed my heart in vain, and washed my hands in innocency. (Psalm 73: 3-13, JKV)

Echoing the sentiments of the writer of Psalm 73, the Old Testament prophet Habakkuk bares his heart and soul to God with a prayer for vengeance against  the unGodly in the opening of the book that carries his name:

The burden which Habakkuk the prophet did see. O Lord, how long shall I cry, and thou wilt not hear! even cry out unto thee of violence, and thou wilt not save!  Why dost thou shew me iniquity, and cause me to behold grievance? for spoiling and violence are before me: and there are that raise up strife and contention. Therefore the law is slacked, and judgment doth never go forth: for the wicked doth compass about the righteous; therefore wrong judgment proceedeth. (Habakkuk 1:1-4, KJV)

Be careful what you ask for in your prayers to God. You may just get it. The answer God gives Habakkuk leaves him totally shaken and confused.

Behold ye among the heathen, and regard, and wonder marvelously: for I will work a work in your days which ye will not believe, though it be told you. For, lo, I raise up the Chaldeans, that bitter and hasty nation, which shall march through the breadth of the land, to possess the dwelling places that are not their’s. They are terrible and dreadful: their judgment and their dignity shall proceed of themselves. Their horses also are swifter than the leopards, and are more fierce than the evening wolves: and their horsemen shall spread themselves, and their horsemen shall come from far; they shall fly as the eagle that hasteth to eat. They shall come all for violence: their faces shall sup up as the east wind, and they shall gather the captivity as the sand. And they shall scoff at the kings, and the princes shall be a scorn unto them: they shall deride every strong hold; for they shall heap dust, and take it. Then shall his mind change, and he shall pass over, and offend, imputing this his power unto his god. (Habakkuk 1:5-11, KJV)

What is Habakkuk’s response to God’s answer? It essentially puts God on trial for using a more wicked people to punish the evil doers of the Israelites.

Art thou not from everlasting, O Lord my God, mine Holy One? we shall not die. O Lord, thou hast ordained them for judgment; and, O mighty God, thou hast established them for correction. Thou art of purer eyes than to behold evil, and canst not look on iniquity: wherefore lookest thou upon them that deal treacherously, and holdest thy tongue when the wicked devoureth the man that is more righteous than he?… I will stand upon my watch, and set me upon the tower, and will watch to see what he will say unto me, and what I shall answer when I am reproved. (Habakkuk 1:12-13 & 2:1, KJV)

from Presenter Media

God wasted no time in responding to Habakkuk’s challenge:

And the Lord answered me, and said, Write the vision, and make it plain upon tables, that he may run that readeth it. For the vision is yet for an appointed time, but at the end it shall speak, and not lie: though it tarry, wait for it; because it will surely come, it will not tarry. Behold, his soul which is lifted up is not upright in him: but the just shall live by his faith. (Habakkuk 2:2-4, KJV)

Thus, we see that the unjust will be judged, but the just shall live by his faith. This passage is quoted three times in the New Testament. In each passage, living by faith is seen in a different context. In Romans 1:17, the context is sanctification and forgiveness from our sins. In Galatians 3:11, the context is justification and the removal of the penalty of our sins. The context of Hebrews 10:38 is the perseverance of the faithful. Therefore, from Habakkuk, we have the message that the unjust will be punished, but the just will live.

courtesy of Wikimedia Commons

There are many references to this concept throughout scripture. We find one more in what may well be the oldest book in the Bible. This concept of the fate of the just and unjust is also explored by the author of the Book of Job, who is most likely a highly educated Jew who lived between the reign of Solomon and Israel’s exile to Babylon. Even he had a great deal of trouble putting into words the internal battle this dilemma caused him. Instead of directly lecturing or preaching, he turned to another effective educational process. He begins the book of Job by metaphorically looking his audience in their eyes and saying to them, “Let me tell you a story about a man…”

There was a man in the land of Uz, whose name was Job; and that man was perfect and upright, and one that feared God, and eschewed evil. (Job 1:1, KJV)

If ever there was a human who deserved to “win,” Job was that man. However, Satan was out to show God up. Thus, he saw Job as a convenient target. If Satan could bring Job down to his level, he would win over again to his side one of God’s favorites, just like he did in the Garden of Eden. Although Job wavered and wound up on the dung heap in sackcloth and ashes (as depicted in the 1880 painting by Gonzalo Carrasco), when he looked squarely at God, he couldn’t say anything negative about Him.

Therefore, whether we look at the Old Testament or the New Testament, at the end of the day, God rewards the righteous and punishes the unjust. An old childhood jingle comes to mind: “Cheaters never win, and winners never cheat.”

Filed Under: Faith and Religion Tagged With: God, Just, Love, Scripture, Unjust

July 4, 2016 By B. Baylis Leave a Comment

CHANGES AHEAD

from Presenter Media

There are some exciting happenings just around the bend for HEBB. I am reopening some of the previously closed operations of HEBB and rolling out some totally brand new ventures. Please stay tuned to the  HEBB website, and my blog  By’s Musings. for future updates on these events. You can subscribe to automatically receive those blog updates by giving us your email address in the box on the right side of this page. You have my word that your address will only be used for that purpose. We guarantee your privacy and will never sell or loan your address to someone else. Announcements of the updates will also be posted on Google+ (Bayard “By” Baylis), Twitter (@ByBaylis), and LinkedIn (Bayard Baylis),

from Presenter Media

If you can’t wait, I will give you some hints; but please don’t keep them to yourselves! Go and tell others. I really want everyone to know about these undertakings. HEBB will soon open its doors to accepting individual and family clients offering Biblical Life Planning counseling, along with individualized help on how to do college:  step-by-step guide on how to prepare for college; evaluate colleges; select the right college for you; complete college admissions and financial aid applications; successfully navigate the first-year of college; and make the most of your total college experience. I have also started writing books again, and am open to accepting certain speaking engagements, either in person or via electronic broadcasting.

from Presenter Media

I have recently started working on another project that I’m tentatively calling The Watershed Collaborative (TWC). It is intended to bring under one umbrella a diverse team of eminently qualified, highly-principled professionals with extensive experience from numerous fields of expertise, and from all segments of the public and private sectors, working collaboratively to help individuals and organizations identify and answer watershed questions. The mission of this proposed consulting alliance is to offer quality, values-based, comprehensive consulting and coaching services to educational institutions, ministries, non-profit organizations, and for-profit enterprises at reasonable prices. The membership of this alliance will consist of only partners who affirm the common goal of providing the highest quality information, advice and other services that are built on the foundation of solid theoretical research, and practical solutions which have been extensively tested in the work arena, uniquely fitted to the clients’ needs.

from Presenter Media

These are exciting times  for me and HEBB. I was never really sure that I would regain any semblance of the capabilities that I used to have. I wasn’t completely confident that I would be able to work again. This has long been a matter of prayer. Over the past three months, it has been wonderful to see God removing many obstacles. However, not by a stretch of anyone’s imagination am I ready to resume a full work schedule. However, much of my thought capabilities have returned, although I am still thinking visually and have to translate the pictures into words to communicate. My endurance is still a question mark. Most afternoons, I find myself in need of a nap to restore my energy.  After a short nap, I am ready to go again and can almost jump for joy.

from Presenter Media


Filed Under: Higher Education, Personal, Writing Tagged With: College, Family, Life Planning, Watershed, Writing

  • « Go to Previous Page
  • Page 1
  • Interim pages omitted …
  • Page 11
  • Page 12
  • Page 13
  • Page 14
  • Page 15
  • Interim pages omitted …
  • Page 42
  • Go to Next Page »

Primary Sidebar

Search

Tags

Admissions Advent Alumni Aphasia Books Caregiver Christmas College Communication Community Activism Condition Disease Disorder Dysesthesia Economics Educational Modality Epilepsy Family Fundraising God Hallucinations Health Care History Humor Knowledge Learning Liberal Arts Love Metaphor Parkinson's Peace Philosophy Problem Solving Reading Recruitment Retention Scripture Student Technology Therapy Truth Verbal Thinking Visual Thinking Word Writing

Categories

  • Athletics
  • Business and Economics
  • Education
  • Faith and Religion
  • Food
  • Health
  • Higher Education
  • Humor
  • Leadership
  • Neurology
  • Neuroscience
  • Organizational Theory
  • Personal
  • Politics
  • Surviving
  • Teaching and Learning
  • Thriving
  • Uncategorized
  • Writing

Meta

  • Log in
  • Entries feed
  • Comments feed
  • WordPress.org
  • Home
  • Blog
  • Overview

Copyright © 2010–2025 Higher Ed By Baylis