Let me reiterate! Campus Housing is an auxiliary service because it is not central to our teaching mission and it is offered on a fee-for-service basis. Image courtesy of Presenter Media.
In 2014, The Washington Post ran an article that reported that “there were 87 colleges across the country that require full-time students to live on campus their first year of college.” Interestingly, The Post did not indicate their source of information. I checked the catalogs of 86 of the 87 institutions. I couldn’t check the catalog of one of the institutions because it closed in 2016 due to low enrollment and lack of funds. It no longer maintains a website. What I discovered about the other 86 institutions was quite informative.
This photograph was taken May 18, 2005, showing Damage Controlmen aboard USS Belleau Wood (LHA 3) instructing U.S. Naval Academy Midshipmen on proper firefighting techniques in Belleau Wood’s Well Deck. The Midshipmen spent two weeks aboard Belleau Wood as part of their summer training program. Official U.S. Navy photograph by JO2(SW/AW) Chad A. Bricks. The image has been released into the public domain by the U.S. Navy. Image courtesy of JO2 Bricks, U.S. Navy, and Wikimedia Commons.
In their catalogs, all 86 of the remaining institutions stated that they required all full-time, first-year students to reside on campus. However, 56 of the institutions indicated that students could petition for an exception to this rule. The 30 institutions that did not indicate any policies for exceptions included two experimental colleges, the five federal-military academies, seven Catholic, male religious-vocational colleges or seminaries, and 16 Orthodox Jewish rabbinical yeshivas or seminaries. Students at the military academies are considered members of the armed services and are on-call 24/7/365 in case of an emergency. Their training must take that into account. Catholic religious-vocational institutions duplicate the living conditions that their graduates must undertake in their church service, i.e., a celibate, monastic life. Orthodox Jewish Collegiate Yeshivas and Seminaries are restricted to young, unmarried males, who must dedicate themselves solely to their studies. Older or married Jewish students desiring to be rabbis attend a Kollel. The 56 institutions that permitted petitions for exceptions included one Tribal college, three public colleges, three state-related military academies, and 49 private institutions.
The Best College Editions of the 2017 U.S. News and World Report indicated that 13 colleges self-reported 100% of full-time, first-year students lived on campus. Image courtesy of Presenter Media.
In 2017, U.S. News and World Report published an article with self-reported institutional information that the magazine had gathered for their annual Best College Report. One item in the report was the percentage of full-time, first-year students who reside on campus. In 2017, they listed only 13 colleges which reported 100% of first-year students living in college housing. All but one of these 13 institutions were from The Washington Post list. When I checked the catalog of the one college that wasn’t included by The Post, I discovered that they require married students to live off-campus. Apparently, they either had no first-year married students or they misrepresented their data to the U.S. News and World Report.
The other 12 institutions were divided into two groups of six colleges each. The first group consisted of the five federal military academies and one experimental college which, accordingly to its catalog, did not accept petitions for waiver of the residency requirement. The second group of six colleges consisted of five private institutions and one state-related military academy. All of these six accepted petitions for waiver of the residency requirement, including the state-related military academy. Is it possible that they had no waiver petitions for 2017, or that they didn’t grant any that they did receive? I think “not.” Could the 100% figure be due to round-off error? How likely is that?
Although campus housing has many benefits for students, the biggest benefit may be the fact that for years, it was almost always a moneymaker for colleges. Image courtesy of Presenter Media.
As I stated in my previous post, the research is overwhelming. Students who reside on campus tend to do better on average and get a more complete educational experience than students who reside off-campus. Is there any other reason why colleges would want students to reside on campus? Prior to the year 2000, there was a very simple explanation. Many schools could make money on residence halls. This is why campus-housing outsourcing firms lined up at the doors of colleges to offer their services. There was money to be made in campus housing. As Mark Twain said in his 1892 novel The American Claimant, “there’s gold in them thar hills.”
For many years, residence halls were the easiest and cheapest buildings to construct on campuses. Image courtesy of Presenter Media.
For many years, residence halls were among the easiest and cheapest campus structures to build. The designs were fairly standard and construction was straight forward, not like specialized academic spaces. Once built, major modifications were not as frequent as updates to other campus structures. All of my full-time employment experience in the academy was prior to 2009. During the decades leading up to Y2K, a college with a good credit rating could fund construction costs for residence halls through low-interest bonds.
The floor of campus housing has cracked under American higher education and is threatening to swallow it whole. Image courtesy of Presenter Media.
If you have been reading my posts about the 21st-century crises facing American higher education, you know that I believe, as a whole, it is in a state of turmoil and chaos. However, working on this post has made me realize that the once-solid ground under campus housing has cracked wide open. How deep into the resulting fissure have colleges fallen in the past decade? For the four decades, I was intimately involved in the planning aspects of campus housing and in the oversight of campus housing managers. During that time, if campus housing was handled properly, the institution did not lose money in this area.
A graph of the Median Cost per Bed in thousand $ from 1999 to 2015. The data is taken from the magazine College Planning & Management. Graph created by the author of this post using Libre Office spreadsheet.
This is no longer the case. In my research for this post, I discovered the Annual College Housing Reportpublished by the Magazine College Planning & Management. Paul Abramson was in charge of the collection and analysis of the data for the report. In his 2008 report, he concluded that the “…cost of residence hall construction is rising and rising rapidly.” In the same report, he continued by stating that the median residence hall built in 2008 would cost almost $26M.
In subsequent reports, by 2013, the median cost of a new residence hall had risen to more than $39M. In 2019, it is estimated that the median cost of a residence hall will be close to $56M. Those numbers blow what we were doing in the 20th century and the very early years of the 21st century right out of the water.
In 2020, it is estimated that the median cost of a bed in a new college residence hall will exceed $100,000. Is a scene similar to this worth $100,000? Is it economically viable for the institution? Image courtesy of Presenter Media.
The last residence hall construction project which I helped plan was completed in 2006, two years after I left that institution. The planning process began in 2003. This residence was designed to house 192 students. The total cost was $3.1M. Our cost of $16,146 per bed was less than half of the median cost per bed of all new residence halls during the period 2003 to 2006.
According to Abramson’s data, our residence hall should have cost us approximately $11.5M. We built it for $3.1M. How could we build our residence hall for less than one-third of what other colleges were spending? There were two primary reasons.
The first was the fact that our whole institution had come together and adopted a Facilities Philosophy. Three of the main tenets of this philosophy were the following:
We guarded our available resources tightly. All financial expenditures supported the mission of the institution. Image courtesy of Presenter Media.
Enlightened frugality: [Our] University operates within a world of limited resources. All financial expenditures for the physical plant must support the mission of the institution. This requires that all solutions to physical planning be comprehensive, with nothing considered in isolation. Issues of building placement, traffic, and parking, engineering systems, natural systems, and aesthetics must be woven together to form a tapestry of buildings and spaces that foster a university culture. Buildings can and should be attractive, but not ostentatious. They should be functional, and not pretentious. They should be designed and built to last, but should not look or feel austere. Buildings and outdoor spaces should exhibit grace, dignity and elegant simplicity.
Form follows function! All campus spaces must be designed and constructed with an express purpose in mind. Planning comes before design or construction. Image courtesy of Presenter Media.
Form follows function: This expression is an architectural maxim that connotes the idea that all spaces, indoor or outdoor, should be designed and constructed with an express purpose in mind. Learning spaces should be designed and built-in terms of the learning that will occur in those spaces. Community spaces should be designed and built with community in mind. This tenet places the priority on the planning and the delineation of intended uses or purposes for given spaces. Planning comes before the design and construction of the space.
The campus should have a common architectural language that can be expressed differently in different venues. Image courtesy of Presenter Media.
Common language: [Our] University should have a common architectural language that should be readily seen throughout the campus. Although there should be common themes, these ideas may be expressed differently in different venues. Each new venue should tie into the existing campus vocabulary, but at the same time should be encouraged to bring in new expressions.
Building off these common tenets kept us on the same track and reduced the possibility of wild deviations in designs across campus.
We developed solid working relationships with vendors that understood us and worked with us. Image courtesy of Presenter Media.
The second reason we were able to hold construction costs in check was that we had developed solid working relationships with two architectural firms, three construction firms, and numerous vendors who understood us and worked with us.
The story of the 192-bed residence hall exemplifies how the tenets of our facility philosophy and working relationships helped us. This new residence hall intended for juniors and seniors was a deviation in design from our typical residence hall. Instead of central hallways with two- or four-person suites on either side, the interior was based on a new design. The exterior of the facility fit in with all of our other buildings on campus. The new vocabulary introduced was a series of balcony hallways overlooking central lounges. Six-person suites were accessed from the balcony hallways. This design answered the desire of our juniors and seniors for more communal, gathering spaces.
We budgeted not only for the initial costs of buildings but for the ongoing costs of operating them. Image courtesy of Presenter Media.
In addition to construction costs, we normally budgeted annual maintenance, housekeeping, and utility (MHU) costs of 10% of total construction costs, or $310,000 in this example. Since this residence hall cost $3.1M, financing it with a 2% bond meant that we could pay off the entire initial cost plus accrued interest in eight years with annual payments of $450,000. We could also pay off half of the entire MHU costs for those eight years. By maintaining an occupancy rate of 95%, in another four years, we paid off the entire MHU for all 12 years. From that point on we were making more than $400,000 annual profit from this building.
Since we normally assumed a life expectancy on residence halls of 20 years before a major renovation was required, this profit accumulated for eight years. At the point we needed a major renovation, we would reset the clock and start the process over again. In my 40+ years in the academy, I only saw two residence halls decommissioned. One was converted to faculty offices and the other was condemned and demolished to make room for a completely new residence hall.
This photograph is a picture of the Niagara River, upstream from the falls. It is almost at the point of no return. The river is picking up speed as it flows toward the falls. The rapids start around the bend in the background. The photograph was taken by Yinan Chen on May 3, 2013, and distributed on www.goodfreephotos.com. This image has been released explicitly into the public domain by its author, using the Creative Commons Public Domain Dedication. Image courtesy of Yinan Chen, goodfreephotos.com and Wikimedia Commons.
American higher education as a whole is speeding toward more white water ahead. The current is running too fast for anchors to work. Some colleges are “up the creek without a paddle” and heading for the giant waterfall. Other colleges have supercharged engines onboard that can possibly keep them out of harm’s way if the captain applies the engines at the appropriate time and turns the rudder in the correct direction.
It’s happened again. I’ve run out of time and space to finish my discussion of outsourcing, auxiliary enterprises, and the sale of institutional assets. I willcontinue my discussion of auxiliaryenterprises next week in my post, The Commercialization of American Higher Education – Part IV.
Student charges and public support don’t provide enough resources to operate American higher education. Cranking harder on those two sources will not be enough. Image courtesy of Presenter Media.
I believe the Commercialization of Higher Education is one of the many dangerous crises facing American higher education in the 21st century. Everyone knows that higher education costs money to operate. It’s also no surprise that those costs keep going up every year. What may surprise many people is that since the earliest days of American Higher Education, colleges have never really been able to operate on the combination of funds that they charge students or the support they receive from public governmental sources. Even in their earliest days, the American Colonial Colleges had to resort to fundraising to supplement the budgetary shortfalls from student charges and public support. In today’s world, the combined sources of student charges, public support and fundraising are still not enough.
Derek Bok’s book, Universities in the Marketplace, exposed one of the fault lines in American higher education. Image courtesy of Presenter Media.
In a previous post A New Millennium – The Same Old Story, Part II, I introduced the idea that the Commercialization of Higher Education posed a serious threat to the academy by citing Derek Bok’s seismic work Universities in the Marketplace: The Commercialization of Higher Education. Bok served as President of Harvard University from 1971 to 1991, and as Interim President from 2006 to 2007, after a faculty no-confidence vote against Lawrence Summers, and his abrupt departure.
Bok wore a traditionalist hat on some issues like the commercialization of higher education. However, there were many issues on which he was ready to “wear a hard hat” and get down to the business of changing higher education. Image courtesy of Presenter Media.
President Bok is known to be something of an enigma. His book Universities in the Marketplace shows him to be a staunch traditionalist on some higher education questions. On the other hand, Bok blisteringly criticizes many aspects and actions of the academy in his books Our Overachieving Colleges and Higher Education in America.
Commercialization of American Higher Education is a monster hiding in the closet. We don’t want to let it out. Image courtesy of Presenter Media.
In his book Universities in the Marketplace, Bok wears a traditionalist’s hat. He warns higher education about a monster hiding in their closet. The monster Bok denounces is the eagerness with which colleges and universities seem ready to “make a buck” wherever they can. I agree with him up to a point.
Many in higher education feel as if they have fallen into a pit from which they can’t escape without help. Image courtesy of Presenter Media.
As I have studied the situation, I believe that many colleges and universities felt that they were pushed into a pit from which there are no avenues of escape.
Without the help of all hands, trying to operate American IHEs without fundraising and other sources of revenue is like trying to row a leaking boat across a lake. You’ll never make it. Image courtesy of Presenter Media.
In the opening paragraph of that post, I made the claim that in my fifty years in higher education, I never saw a public or private, non-profit institution of higher education cover “their educational and general costs with just tuition and fees.” Trying to do so is like trying to row across a lake in a rowboat with a large hole in it. Colleges and universities have an inherent structural operating deficit built into their fiscal models.
In the aforementioned post, I identified the five sources of revenue that institutions of higher education (IHEs) have available to them:
Tuition and fees
Fundraising, advancement or development efforts
Endowment income, appreciation, interest or dividends
Auxiliary enterprises
Governmental appropriations (usually reserved for public institutions)
There is no magical money tree dropping hundred dollar bills for the eager IHEs waiting to scoop them up. Image courtesy of Presenter Media.
Not appearing in this list is a magical money tree that drops money like leaves in the fall. Borrowing a phrase from an old television commercial, IHEs have “to make money the old fashion way. They have to earn it.” The most traditional avenue is charging students tuitions and fees for educational services such as courses, credits, certificates, and degrees. Prior to the formal separation of higher education into public and private sectors, many IHEs were the recipients of governmental appropriations (funding). Today, governmental appropriations are almost exclusively reserved for public institutions.
Data from the Delta Cost Project. Graph constructed by this blog’s author using Libre Office Software
I began writing this post with what I thought was going to be a simple agenda. Consistent with my previous claim that public and private, non-profit American IHEs can’t cover their educational and general expenditures with just tuition and fees, it would follow that the difference would have to be made up from other sources.
In 2016 when I was working on the previously mentioned series The Business Model of All of Higher Education Is Broken, one resource that I relied on for data was the Delta Cost Project managed by the American Institutes for Research. Their data reinforced my findings from my research on IPEDS data from the 1980s.
As a single, independent researcher, I don’t have the time to track down all the audit reports. Image courtesy of Presenter Media.
Unfortunately, it appears that the Delta Cost Project was abandoned several years ago. Therefore, the best source of current data is from IPEDS or the annual audits of the IHEs themselves. The difficulty with the IPEDS data is that the reporting categories are different than the ones used by the Delta Cost Project, making it difficult to match up the results. The problem with looking at the annual audits of IHEs is obviously the time and availability factors. Public institutions are required to publish their annual audits. Private institutions are encouraged, but not required to publish their audits. I don’t have enough time as one researcher to track down thousands of audit reports.
Governmental appropriations are reserved almost exclusively for public institutions. Image courtesy of Presenter Media
As noted in my opening paragraph, except for the very early days of American higher education, the revenue source Government Appropriations is strictly reserved for public institutions. I will be dealing with how well that source of revenue is holding up in a future post entitled The Shrinking Public Support of Higher Education.
Two sources of revenues for American IHEs, Fundraising, advancement or development efforts and Endowment income, appreciation, interest or dividends, are closely related and highly correlated. In planning this post, I believed that I could dismiss these sources of revenue as inadequate to make up the shortfall in a couple of short paragraphs and then move on to the topic of this post. I was wrong! As I began writing, the couple of short paragraphs turned into a long post in and of itself.
Too often, the impression potential donors have of IHEs’ fundraising efforts is that of a panhandler begging for their next meal. Image courtesy of Presenter Media
In the opening paragraph of this post, I alluded to the necessary fundraising efforts of Colonial Colleges to make ends meet. In today’s world, the pressure to raise outside funds has increased many times over. In 2018, the most recent year for which data is available, voluntary support for all of American higher education was $46.73 Billion. According to the Council for Aid to Education (CAE), this represented a 7.2% increase from 2017. Both of these statistics sound impressive until you look inside the numbers.
They can see the other side. However, the gap between the “Haves” and the “Have Nots” is usually too wide to cross. Image courtesy of Presenter Media
Unfortunately, the distribution of gifts is very uneven. It is the story of the great divide between the haves and the have nots. The top 20 fundraising institutions raised $13.26 Billion (28.4% of all voluntary support for higher education). These 20 institutions represent less than 0.6% of all US degree-granting IHEs, public and non-profit private, required to submit data to the federal Department of Education’s National Center for Educational Statistics (NCES).
What about all the other colleges and universities? According to the Council for the Advancement and Support of Education (CASE), more than two-thirds of all funds raised (68% – $32 billion) this past year went to public and private doctoral/research universities. These institutions are raising billions of dollars in multi-year campaigns heavily focused on capital expansion, research programs, and endowments.
Too many students are held back by underfunded community colleges. Image courtesy of Presenter Media
According to the same report, less than one-half of one percent of the funds raised (0.4% – $0.19 billion) went to community colleges. Even though community colleges educate more than 40% of all American undergraduates annually, and the largest proportion of first-generation, low income, minority, and at-risk students, these institutions are almost invisible to the donors who regularly contribute to American higher education.
Restricted gifts are locked piggy banks which can be unlocked only for specific projects. Image courtesy of Presenter Media.
Funds raised by IHEs typically go into two different accounting pots which are, in turn, divided into two pots. The first division of donations consists of two pots that are labeled restricted and unrestricted gifts. Although IHEs routinely ask donors to give contributions for specific purposes, donors may designate the assignment of their donations to particular projects (restricted gifts) or leave the assignment to the discretion of the institution (unrestricted gifts).
Endowments are rainy day funds for colleges & universities. Image courtesy of Presenter Media.
Funds from each of these two pots are further divided into two more pots. The first of these pots is called the current fund, which is used to pay for current operating expenses or to balance the budget in the year in which the donation is received. The second is called endowment, which consists of funds reserved for future spending. These funds comprise the equivalent of a savings account or a rainy day fund for the institution.
The second of the closely related sources of revenue for colleges and universities was Endowment income, appreciation, interest or dividends. Gifts to institutions are not always in the form of cash. Donors may give physical property, stocks, bonds, or gifts of services. These gifts are sometimes called paper or non-liquid assets. Other than gifts of service, the perceived value of these gifts is the amount of money the institution could get by “cashing in” or selling the asset.
Appreciation is not like having a bank teller hand you money while you do nothing. You have to either sell the property or borrow against it. Image courtesy of Presenter Media.
Appreciation is a different ballgame altogether. It is the increase in the appraised value of a property. It only adds to the real wealth of an institution in two ways. The first is by selling the property and reaping the harvest of that increased value. Instead of disposing of the asset outright, an institution could borrow against the appraised value of the asset. Borrowing against an asset has two disadvantages. The first is that the loan is now a liability to the institution which must be repaid at some point. In addition, loans usually carry the liability of ongoing interest charges which must be paid periodically. The second disadvantage is that as collateral for a loan, the use of that asset may be restricted partially or fully until the loan is repaid.
Depending upon whether the initial gift of stocks and bonds was restricted or unrestricted, the institution may have to restrict the use of resultant appreciation, interest or dividends to specific projects.
If IHEs always spend more money than they receive, they will eventually fail. Image courtesy of Presenter Media.
Turning our attention to endowments, we run into a new set of problems. We have an interesting dilemma: The public and non-profit private institutions can’t legally show a profit in annual audits or on their cash flow sheets. However, if they continually expend more than they take in their revenues, they will eventually fail (as many have). How do we handle these accounting anomalies? Non-profit organizations can legally hold savings accounts for future spending. Rainy day accounts for IHEs are actually encouraged, not only by federal and state law but by most educational pundits and commentators.
1% of US IHEs appear to be “sitting easy” on piles of money. Their endowment tops $1 billion. Image courtesy of Presenter Media.
If that is the case, what’s the current state of endowments for IHEs? It is also a land divided. The chasm between the haves and the have nots in endowments is just as great as the one that exists in the land of fundraising. The rich get rich and the poor get poorer. There are two ways to measure endowments. You could rank institutions in terms of total endowment in current dollar value, or you could measure it in terms of the current dollar value of endowment per student enrolled.
Which measure you chose probably depends upon your view of how endowment should be used. If you believe that endowment should strictly be dedicated to assisting students in attending a particular institution, you will use the value of endowment per student enrolled. If you are more open to taking a broad, holistic view of the health of an institution, you will look to the total dollar value of the endowment. It doesn’t really matter which way you look at the top institutions. You will find many of the same names. The top 30 institutions by the total endowment are in the list of the 100 institutions of endowment per student and vice versa.
Look at us! We’ve got it made. We’re standing on a pile of money. Image courtesy of Presenter Media.
Why did I choose the number 30? It happens to represent approximately 1% of the public and private, nonprofit 4-year colleges in the United States. In the last several presidential elections there has been much discussion about the wealthiest 1% in the United States. So I thought I would follow the lead of Forbes Magazine which in July, 2016, published the article How the Wealthiest 1% of Colleges Own Higher Education. Forbes’ conclusion in 2016 was that the top 30 colleges and universities held over 52% of all endowment funds. Forbes has not updated their data. From my calculations, using the most recent 2018 data available from the National Association of College & University Business Officers (NACUBO) and the Teachers Insurance and Annuity Association of America (TIAA), the top 30 colleges may have increased their holdings to almost 54% of all endowment funds.
One quick aside: My 2018 top 30 list differs by two colleges from Forbes’ 2016 top 30 list because two institutions just outside the Forbes’ list received very large gifts designated for endowment during the past two years. If you pull back your focus just a little, the top 100 schools (just over 3% of colleges) in both 2016 and 2018 held almost 80% of all endowment funds. In 2018, every one of the top 100 colleges had an endowment valued at more than $1 billion. Pulling back a little further, in both years the bottom 20% of institutions held less than 1% of all endowment funds.
Where can we find the money needed to run our college? Image courtesy of Presenter Media.
In the face of a structural operating deficit, declining public support, and a lack of sufficient endowments or donations to fill-in these gaps, many IHEs felt they had to turn to other sources of revenue. Where could they find these sources? The two most obvious solutions are to resort to auxiliary enterprises or to sell off assets.
Whenever everything of value is sold, the last one out of the door should turn off the lights and lock the door behind them. Image courtesy of Presenter Media.
Auxiliary enterprises provide goods or services to college personnel or the general public on a fee-charged basis. These enterprises are meant to be profit-making, or at the least self-supporting. In some circumstances, selling off assets can be considered a last-ditch effort. Many view it as a final desperate action before closure.
The major decisions for both avenues involve what properties or services can or should colleges offer. I will take up that question in my next post, The Commercialization of Higher Education – Part II.
Only a few, chosen ones, the best of the best may enter into Nirvana. Enter faculty and enjoy your rewards on your terms. Image courtesy of Presenter Media.
In a previous post A New Millennium – The Same Old Story, Part I, I introduced the topic of Faculty Reward Systems and Faculty Priorities as one of the current crises in the academy. In the short note about these problems, I referenced an article written in 2001 with the intriguing title Paradise Lost: How the academy converts enthusiastic recruits into early-career doubters. In the almost two decades since that article appeared there have been hundreds of articles lamenting the doleful and declining conditions in the academy for all faculty, not just the early recruits, but even the seasoned veterans.
Paradise Lost. Adam and Eve expelled from Eden. An etching by Gustave Dore from a Dutch Bible. As a faithful reproduction of a two-dimensional work of art in the public domain, this image is in the public domain. Image courtesy of Jan Arkesteijn and Wikimedia Commons.
My first reaction to the article’s title was one of affirmation. I thought I understand the authors’ frustration with the impression that faculty as a whole had lost access to the Garden of Eden, the Land of Milk and Honey. However, the more I reread Milton’s tragic epic the more confused I became. The allegoric allusions between the Biblical creation story and the plight of modern university faculty made less sense to me.
A 16770 line engraving of John Milton by William Faithorne. As a faithful reproduction of a two-dimension work of art in the public domain, it is in the public domain. Image courtesy of Jfhuston and Wikimedia Commons.
In his 1674 version, Milton begins Paradise Lost – Book I with a verse that is often referenced and quoted:
OF Mans First Disobedience, and the Fruit Of that Forbidden Tree, whose mortal tast Brought Death into the World, and all our woe, With loss of Eden, till one greater Man Restore us, and regain the blissful Seat, Sing Heav’nly Muse, that on the secret top Of Oreb, or of Sinai, didst inspire That Shepherd, who first taught the chosen Seed, In the Beginning how the Heav’ns and Earth Rose out of Chaos: or if Sion Hill Delight thee more, and Siloa’s brook that flow’d Fast by the Oracle of God; I thence Invoke thy aid to my adventrous Song, That with no middle flight intends to soar Above th’ Aonian Mount, while it pursues Things unattempted yet in Prose or Rhime. And chiefly Thou, O Spirit, that dost prefer Before all Temples th’ upright heart and pure, Instruct me, for Thou know’st; Thou from the first Wast present, and with mighty wings outspread Dove-like satst brooding on the vast Abyss And mad’st it pregnant: What in me is dark Illumin, what is low raise and support; That to the highth of this great Argument I may assert Eternal Providence, And justifie the wayes of God to men.
Where did that truck come from? I was minding my own business and it just knocked me down and ran me over. Image courtesy of Presenter Media.
Having read the Trower, Austin, and Sorcinelli article many times, I don’t get any sense that they are attempting to “justify the ways of God to men.” On the contrary, they are blaming fate and the evil administrations of universities for taking away the riches of which they had dreamed and for which they had worked so hard. I find no sense of contrition or admission of wrongdoing on the part of the faculty that have been expelled from paradise.
The gates to paradise have been closed to all faculty. Image courtesy of Presenter Media.
I selected this article to introduce the topic for a number of reasons. The first reason was very personal. The article was based on the authors’ presentation at the 2001 Conference on Faculty Roles & Rewards, held February 1–4, 2001, in Tampa, Florida. The three authors of the article, Cathy A. Trower, Ann E. Austin, and Mary Deane Sorcinelli, were invited by Gene Rice, director of the American Association of Higher Education Forum on Faculty Roles & Rewards to make a combined panel presentation at the Forum’s annual meeting.
A divided opinion within the audience with faculty cheering it, while administrators and trustees panned it. Image courtesy of Presenter Media
I was at that Forum and I remember their presentation and the mixed response it received from the audience. The faculty side of the crowd loved and cheered the presentation and its conclusions. The administrators in the audience viewed the presentation with semi-veiled skepticism. A couple of trustees with whom I spoke after the presentation expressed undisguised disdain for any thought that faculty had an unalienable right to Nirvana and that trustees were in any way or form complicit in destroying paradise.
The day the AAHE folded was the day the music died. Higher education lost a great resource. Image courtesy of Presenter Media.
I think I missed only one of the dozen Forums on Faculty Roles & Rewards sponsored by the AAHE before it folded in 2005 due to lack of support from the higher education community. In my mind that was a sad day for American higher education.
The American Association of Higher Education was the only membership organization in higher education that was fully open to everyone involved in higher education. It embraced graduate students, faculty, student affairs professionals, administrators, trustees, the staff of higher education organizations, government officials, journalists, higher education commentators, and funding sources.
The AAHE was a forum for airing disagreements. Sometimes those disagreements became heated. Image courtesy of Presenter Media.
In the end, its diversity was probably the prime reason for its downfall. It wasn’t specialized enough. Many faculty thought student affairs professionals and administrators had nothing to offer them. Student affairs professionals and academic administrators used different languages. Trustees became quickly frustrated with the bickering between the groups. Graduate students were only interested in finishing their degrees and getting jobs. The government officials felt belittled and badgered for more money for education. Commentators and journalists found cheaper ways to get the stories they needed for their articles. The funding sources only heard cries for more funds and saw little appreciation for their prior gifts.
In spite of its obvious problems, I still believe the AAHE was the best higher education association of the 20th Century. It was a one-stop shop for the most recent research on higher education topics and practical solutions to higher education’s most troublesome problems which had been tested in the crucible of real applications.
I had a soft spot in my heart for the AAHE. It was a great organization. Image courtesy of Presenter Media.
In the interest of full disclosure, I admit that I had a soft spot in my heart for the AAHE which impacted my choice of the introductory article. I was privileged to make presentations at ten AAHE conferences: one Annual Meeting; two Technology Conferences; two Faculty Roles & Rewards Forums; and five Assessment Forums. I was invited to make one presentation at a Faculty Roles & Reward Forum and one at an Assessment Forum. For that Assessment Forum, my presentation was designated the principal offering of a given time slot and I had my picture in the conference program. I felt honored to have the opportunity to present an assessment research project design to an audience of over 2,000 higher education professionals at one time. The other eight AAHE presentations went through the normal vetting process by which conference presentation proposals were judged.
I was privileged to serve on two panels reacting to presentations by keynote speaker Gene Rice. Image courtesy of Presenter Media
The invitation to present at the Faculty Roles & Rewards Forum came from Gene Rice. Six months after the AAHE conference where Trower, Austin, and Sorcinelli presented their research findings, Gene Rice was the keynote speaker at a Faculty Development Conference sponsored by the Council For Christian Colleges (CCC). This organization was the predecessor to the Coalition for Christian College & Universities (CCCU). In that intimate setting of approximately 80 faculty members and administrators from 50 Christian colleges, Gene made three plenary presentations over the three-day conference. The format for the conference called for a structured panel response and an audience free Q&A sessions after each of Gene’s talks. I was scheduled to be on one of those panels. However, when at the last minute a panel member for another talk had to withdraw, I was asked to sub on that panel also. Thus, I had the opportunity to comment on Gene’s work twice during the conference, in addition to a presentation that I made on some research that I did on faculty salary models and scales within the CCC.
This conference was not the first time that I had met Gene Rice. Due to his close association and work with Ernie Boyer, Gene spoke once at Messiah College. Ernie was an alumnus and a long-time trustee of Messiah College. However, whatever I said at the CCC Faculty Development Conference must have impressed him. He sought me out at the luncheon on the closing day of the conference and invited me to present at the next Faculty Roles & Rewards Forum. I told him I would think about it, and 30 seconds later I agreed to do it.
As early as 1970, discussions were beginning about where faculty allegiance and hearts were. Were faculty more likely to be loyal to their institution or more committed to their discipline? The answer wasn’t even close. The overwhelming majority of faculty felt more loyalty to their discipline than to their institution.
There are several reasons for this. The first is the discipline was their first passion. They have spent years immersed in the discipline, training and straining to reach its heights. They see the institution as a means to the end. It is a necessary evil to achieve their goal of climbing to the summit of the discipline.
I raise a glass to toast and honor my discipline. It has nurtured and sustained me when others have deserted me. Image courtesy of Presenter Media.
The second is expressed by James Dixon (pseudonym of a professor in the humanities at a college in the South) in the Chronicle of Higher Education December 2015 article Loyalty, Schmoyalty: What do you do when your devotion to your institution is not reciprocrated?. Dixon in a vindictive diatribe decries the “corporatist administrators”, “bitter colleagues”, and the “faceless abstractions like departments and colleges” that inhabit higher educational institutions. [Italics mine]
No more! I finished with those things. From now on, I will only do what is absolutely required by my contract or benefits me or the people that I care most about. Image courtesy of Presenter Media.
Dixon summarizes the main points of the article, in the middle of it with the following paragraph:
“But at this point in my career, my priorities have changed. I simply decline to do anything for my department or institution that: (a) interferes with my family life, (b) isn’t strictly required by my contract, or (c) does nothing to benefit me or the people I care about most.”
Senior faculty should leave the grunt work of spinning the mouse cage wheels to the junior faculty. Image courtesy of Presenter Media.
Dixon goes on to state that senior, tenured faculty should concentrate on the things that can reward them with love and respect: their family, their discipline, congenial colleagues, and the process of teaching. Leave all the grunt work like committees [Italic emphasis, mine] to the junior, non-tenured faculty so that they can reach the point in their careers where they can concentrate on the really important things. [Italic emphasis, mine]
Faculty work hard the meager pittance that they receive from their institutions.
As a means to an end, institutions do provide faculty with monetary rewards in order to “make a living for oneself and one’s family.” Over the past half-century, there has been much discussion about this. Returning to Gene Rice and why he asked me to present at the Faculty Roles and Rewards Forum, my presentation at the CCC conference was on some research that I had done on faculty pay.
At this time, as a group, the 80+ CCC institutions were fairly uniform. They were generally small. The average enrollment was about 1,200 students. They averaged just under 100 full-time faculty members. Although a few of them were experimenting with non-traditional education and graduate education, most were almost exclusively traditional, residential, liberal arts and sciences, undergraduate colleges.
Traditional faculty ranking system: Top step – Full Professor; second place – Associate Professor; third place – Assistant Professor; not on the podium – Instructor. Image courtesy of Presenter Media
In one way that the CCC institutions resembled the rest of higher education was the fact that more than 97% had a traditional ranking system for faculty: Instructor, Assistant Professor, Associate Professor, and Full Professor. Only two institutions in the organization did not have faculty ranks.
With the exception of All 4-Year Publics and 2-Year Privates, the CCC institutions mirrored the IPEDS data for Institutions with Tenure Systems. Image from NCES Data and Data collected by this blog’s author. The graph was created on Libre Office Software by blog’s author.
There were small differences between the CCC institutions and higher education in general related to the question of faculty tenure. In 1995, according to AAUP statistics, approximately 35% of all faculty were tenured or on tenure-track, while 33% were part-time faculty and almost 20% were graduate students. However, the AAUP statistics also indicated that 65% of all full-time faculty were tenured or on tenure-track. College Board data indicates that 92% of public four-year institutions had tenure systems, while 66% of private four-year institutions offered tenured.
The 1995 picture at CCC institutions was slightly different. The percentage of all faculty that were part-time was just over 40%. Since very few of the CCC institutions offered graduate programs, less than 1% of faculty were graduate students. Just over 37% of CCC institutions did not offer tenure at all, mirroring the College Board data for private four-year institutions. At the CCC institutions, just over 50% of all full-time faculty were tenured or on tenure-track, which is less than the percentage for all institutions from the AAUP data.
Annual negotiations over salary may carry the connotation of begging for more from the boss. Image courtesy of Presenter Media.
One key aspect of my research was the question of whether institutions used a faculty pay scale or relied on annual negotiations or a negotiated starting salary and fixed annual increases. Similar data is not readily available for all four-year institutions. For the CCC institutions in my data set, 97% had fixed salary scales of some sort. Only 2% relied on a negotiated starting salary with fixed annual increases, with the other 1% resorting to annual negotiations.
In my survey, I found that 80% of CCC institutions claimed they had no disciplinary differentials in their salary scales. This egalitarian approach seems to be much different from the general higher education approach. Most likely it is an expression of the faith-based, Biblical ideal of equality and reverence for everyone, and the common service for the Kingdom.
“There is neither Jew nor Greek, there is neither bond nor free, there is neither male nor female: for ye are all one in Christ Jesus.” (Galatians 3:28, KJV)
The results of the annual College and University Professional Association for Human Resources (CUPA-HR) salary survey show significant differences by discipline in salaries for faculty with the same rank and experience across all of higher education. Salaries for business and finance faculty average twice the salaries for humanities and social science faculty. Overall, the salaries at CCC institutions ranged from 30 to 70% of the salaries listed in the AAUP or CUPA-HR surveys. CCC faculty saw their teaching as a ministry to which they were called.
For all of the institutions that indicated that they had a fixed salary scale, they described it in terms of ladders or sets of stairs. They all began with one uniform base salary. The differences occurred in what institutions used to determine an initial salary and annual increments.
In my survey, I asked about items that went into determining a faculty member’s initial salary. Every institution indicated that a faculty member’s academic experience, academic degrees and credentials, and starting rank were included as factors in starting salaries. Only 25% of institutions included a factor for professional experience outside the academy. As noted earlier, 20% of CCC institutions factored an individual’s discipline into the salary equation. In all such cases, this factor was positive for a few in-demand disciplines, while there were no subtractions for the many disciplines with lesser demand.
Even in good economic times, a quarter of the CCC institutions had some economic trouble, and another quarter was very strained. Data collected by blog’s author, with graph created on Libre Office software.
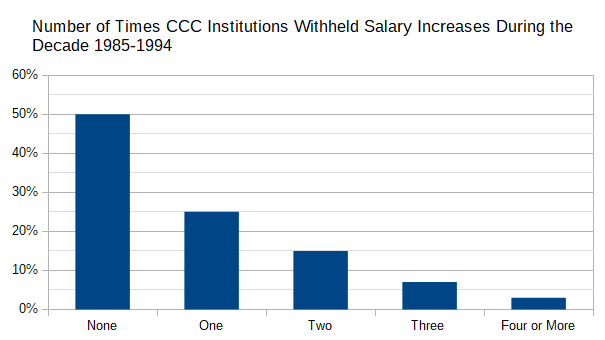
I next asked about annual increases. In the decade from 1985 to 1995, the national economy was generally good and inflation had cooled off after the flame up of the 1970s. There was only one downturn around 1992. Therefore, I asked during the decade 1985 to 1994, how many times were salary increases given. Within my survey universe of CCC institutions, 50% gave increases every year, 25% withheld salary increases once, 15% withheld salary increases twice, and 10% withheld increases 2 or more times.
The next set of questions dealt with the factors that went into determining the amount of the increases when they were given. Every institution indicated that they gave an increase for the extra year of service and any promotion in rank that occurred during the preceding year. In addition, 60% of the institutions said that they gave credit for being awarded tenure.
One of the hot buttons in faculty salary and reward circles of this period was the question of merit pay. Of the CCC institutions, 50% said that they rewarded meritorious service with a monetary award. Most of these (42% of all CCC institutions) offered these rewards as one-time bonuses, while the remainder (8% of all CCC institutions) gave the faculty member a step reward, which in effect carried over to succeeding years.
The final set of questions in my survey dealt with whether institutions took inflation into account in salary increases and, if so, how did they handle it. Of the 90% of CCC institutions that regularly gave annual increases (7 or more times in the decade 1985 to 1995), a significant majority (70%) treated the Cost of Living Adjustment (COLA) as an adjustment to the previous year’s salary, which meant it carried over from year to year. The remaining institutions (30%) credited the COLA as an adjustment to the base salary only. Over the years, this had a negative effect on faculty salaries in keeping up with the cost of living.
The final question returned to the question of the compressed nature of CCC faculty scales in light of the tendency toward egalitarianism. As a Chief Academic Officer, I can guarantee that it was much easier for me to hire an entry-level faculty member rather than a senior faculty member. This was particularly true if the senior faculty member was coming from a public or non-sectarian four-year institution. Our entry level salaries compared much more favorably to other institutions than did our senior-level salaries. The last question asked whether annual increases were applied equally across the board, or were adjustments made by rank. Not surprisingly, egalitarianism won out. More than 80% said increases were always equal percentage-wise across the board. Only 20% said that occasionally adjustments were made by rank, in order to honor senior faculty.
It might not have been as dramatic as God speaking to Moses via the burning bush, but still, God calls faculty to CCC institutions. Image courtesy of Presenter Media.
After presenting this data, my colleagues from public and non-sectarian institutions expressed surprise and pity. They could not understand how CCC institutions could attract quality faculty under these conditions. My answer was that we couldn’t attract them. They had to have a sense of calling from God, and that His Spirit did the convincing.
The next crisis facing American higher education with which I will attempt to deal is The Commercialization of Higher Education.
The topic of “Adjunctification of the Faculty” has turned out to be a giant can of worms. Image courtesy of Presenter Media.
Really, I didn’t plan this! When, I saw that the first topic of my series of problems in American higher education turned out to be the “Adjunctification of the Faculty“, I knew it going to be complicated and involved. It wasn’t until I started writing this post did I realized how really complicated and involved it was, and how difficult it was going to be to write this post. It has turned out to be a gigantic can of worms.
Junctification: So much has been written – So much to read – So much work to do – So little time to do it!. Image courtesy of Presenter Media.
Where does one begin? In mathematics, we were taught that there were two places to begin to address a problem. The first was to find what others had done and written concerning the problem. In terms of the idea of adjunctification of the faculty, I found the first usage of the term only dated back to the 1980s. However, since its introduction to educational jargonese, much has been written about it. I had a great deal of reading and study to do on the subject.
Adjunctification: Too new and too specialized to be included in the dictionary. Image courtesy of Presenter Media.
Returning to my mathematical roots, the second place to begin trying to address problems was to define our terms. To understand the concept of “adjunctification of the faculty” let’s start with a definition. Since the term “adjunctification” is a very recent addition to educational jargon, I didn’t find one dictionary which included it.
Thus, we should probably start by looking at the definition of adjunct, the root word of adjunctification. The term adjunct has been used in the English language since the 16th century. It is derived from the Latin word adiungō, which means to “to join”.
An adjunct faculty member often feels like a homeless, second-class citizen in the academy, living out of a cardboard box. Image courtesy of Presenter Media
In many dictionaries, the word adjunct means “something adjoined or added to the essentials, usually as a supplement or subordinate.” In common usage, it often carries the dismissive or disparaging connotation of something that is less important or not essential.
If we were to rely on this common dictionary definition, an adjunct faculty member is someone who is added to the teaching staff of a college in a temporary or subordinate capacity. Unfortunately, as is often the case, higher education experts have added extra terminology to the discussion, which only confuses the matter more. One such term is contingent faculty.
AAUP definition of Contingent Faculty: Any individual who is non-tenure track faculty. Image courtesy of Presenter Media.
The word contingent is also a word which is loaded with negative connotations. One of its primary meanings is “occurring only if certain unpredictable conditions exist.” One of the premier higher educational organization, The American Association of University Professors (AAUP), has stepped forward and planted its flag on the following definition of contingent faculty: “non-tenure track faculty, in all their various forms.”
AAUP has set itself up as the organization to certify quality higher education in America. Image courtesy of Presenter Media
Since its founding in 1915, The AAUP has laid claim to the role of the standard bearer for academic freedom, shared governance, and quality in American higher education. In its mission statement, it sets itself up as the primary organizations which defines the fundamental professional values and standards of higher education, in order to ensure higher education’s contribution to the common good.
The AAUP also functions as a labor union pressing for faculty rights. Image courtesy of Presenter Media.
In its mission statement, it also puts on a labor union hat. It asserts its duty and responsibility to the job of promoting the economic security of faculty, academic professionals, graduate students, post‐doctoral fellows, and all those engaged in teaching and research in higher education.
There are two bodies of research. The first establishes the fact that many part-time faculty are conscientious and are excellent instructors. The second establishes the fact that for some students alternative modes of instruction such as online education can be as, if not more, effective than the face-to-face mode.
It is a given that Face-2-Face instruction is the BEST! We can ignore other research because it’s wrong. Image courtesy of Presenter Media.
Much of this research is discounted or ignored by higher education commentators. Most of the articles on contingent faculty are written from the presumptive position that the best education is provided by full-time, tenure-track faculty in a face-to-face setting.
Given this starting position, it is natural to argue that it is in the best interest of everyone to increase the number of full-time, tenure track faculty and the availability of face-to-face contact between students and these full-time, tenure track faculty. Even if this statement is true, that does not prove or guarantee that its inverse is true. Thus we can’t assume that decreasing the number of contingent faculty and eliminating alternative modes of education will provide the best education possible for all students.
The collection of educational data in the United States has a spotted history. One of the few specific responsibilities given the federal Department of Education at its founding in 1867 was the collection of annual higher education statistics related to the number of approved colleges or universities offering degrees, along with the total number of enrolled students, graduates, and faculty. Prior to WWII, there were few organized attempts to count or track the number of faculty members employed by American institutions of higher education by classification. Since the end of WWII, the AAUP has been at the forefront of the effort to count and classify instructional staff at American institutions of higher education. More recently the U.S. Department of Education has reentered the fray with its annual surveys associated with the Integrated Postsecondary Education Data System (IPEDS) and the National Center for Educational Statistics (NCES). The federal efforts are now coordinated through the efforts of the Institute of Education Sciences (IES), the statistical, research and evaluation arm of the U.S. Department of Education.
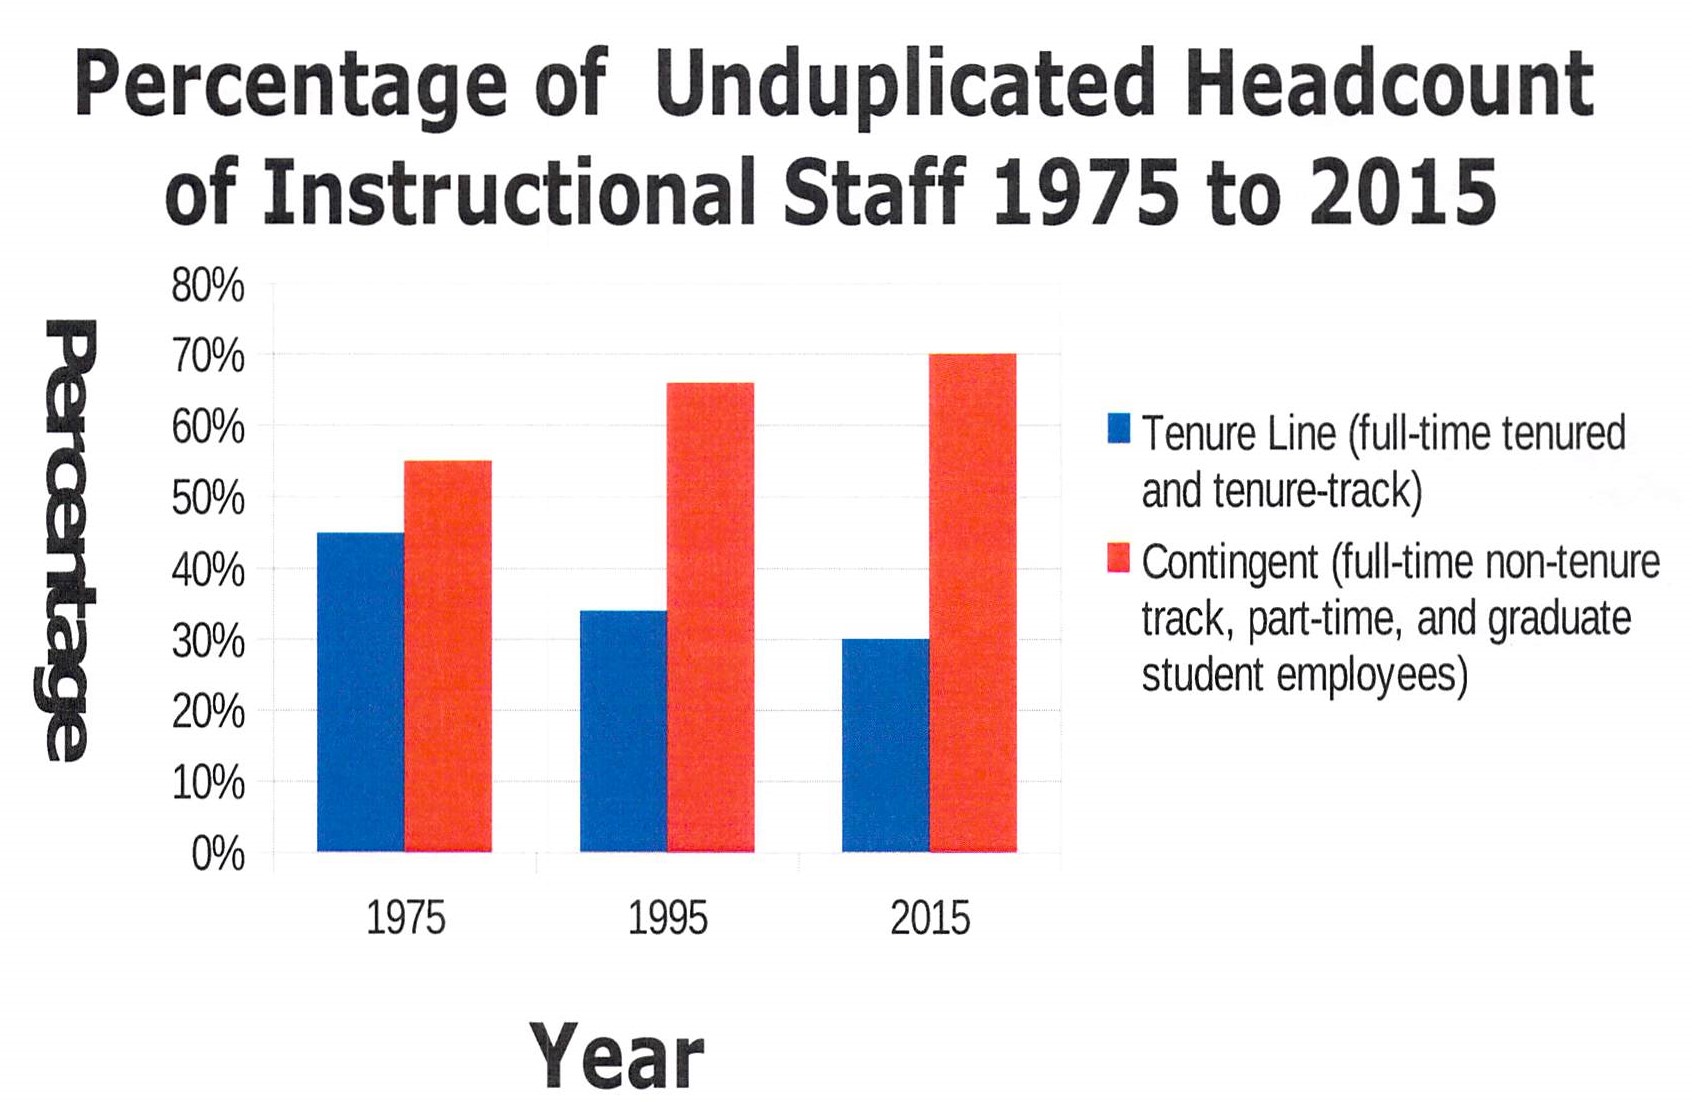
Data from the AAUP. Graph constructed by the blog’s author using an Excel Spreadsheet.
Since the late 1960s, the AAUP has been tracking and decrying the increasing reliance on contingent faculty in American higher education. For example, the AAUP released a copy of the graph to the right, representing the changes in the headcount of tenure-line (full-time tenured and tenure track faculty) and contingent faculty (all other instructors).
Although I am convinced the information presented in the graph is accurate, it is potentially none the less extremely misleading. A quick glance at the graph could leave one to believe that in 2015, only 30% of the classes taken by American college students were being taught by tenured or tenure-track faculty, while 70% were being taught by contingent faculty.
First of all, we don’t have that data. No one is collecting the data nationally on who is teaching whom. In the early 1980s, I was collecting that data for one particular college. That college was a small, baccalaureate-level, liberal arts college with no graduate programs. It offered tenure to faculty with the rank of Assistant Professor or above. Using AAUP definitions, of the 103 individuals who taught classes, 46% were tenure-line and 54% were contingent.
With this data, one might be tempted to say that it was more likely for a student to be taught by a contingent faculty than one on the tenure-line. There is more to the picture. As a baccalaureate-level, liberal arts college, the faculty’s primary responsibility was instruction. For full-time faculty, the minimum teaching load was 12 credits per semester. Since course sections carried anywhere from 0 to 4 credits per sections, the average section load for tenure-line faculty was 4.3 sections per semester. Since there were only 4 full-time instructors who were not on the tenure-line, the average number of sections taught by contingent faculty was 1.5 sections per semester.
In addition to the fact that the average number of sections taught by faculty were heavily weighted toward the tenure-line faculty, the average enrollment per section was heavily weighted toward them also. It was also the case that the tenure-line faculty were more likely to teach the 3 and 4 credit sections, while the contingent faculty taught more of the 0 (science labs) to 2 credit sections.
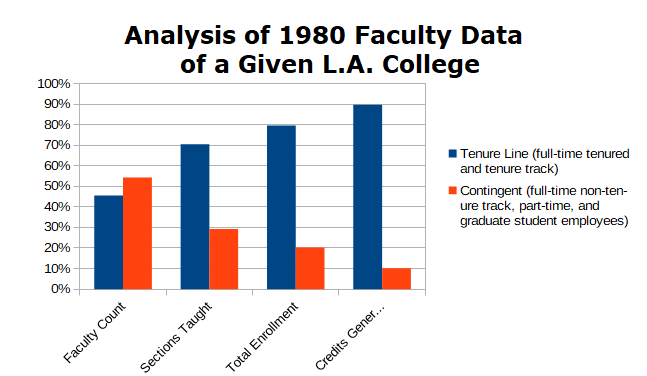
1980 Faculty Data for a given liberal arts college. Data compiled by the blog’s author and graph constructed using an Excel Spreadsheet.
The graph to the left indicates the percentage differences between tenure-line and contingent faculty, if we were to look at faculty headcount, the number of sections taught, student section enrollments, and student credits generated. This graph paints a very different picture of how likely a student would end up with a tenure-line faculty versus a contingent faculty, even in a college where the contingent faculty outnumber the tenure-line faculty.
The AAUP as a faculty organization explicitly approaches situations from the faculty point of view. That point of view generally presupposes that a full-time, tenure-line faculty member is better than a contingent faculty member. One of the reasons given by an advertisement from the 1960 AAUP Bulletin for why faculty should join and support the AAUP indicates that the organization…”Tries to find common ground with administrators and trustees, for the establishment and observance of professional principles.”
Those professional principles were established from the faculty point of view. In my experience, this has meant that an institution’s first step should be to hire full-time, tenure-track faculty. For an institution that is operating a department of music, and not a conservatory, this is fiscally impossible and makes no sense for the institution. In this case, the AAUP response is to pay a private lesson instructor or ensemble conductor at the equivalent rate to a full-time, tenure-track individual doing that same duty. The absurdity of this idea is obvious when one tries to calculate equivalencies.
A full-time, tenure-track faculty member is doing much more than just giving private lessons. He or she should be involved in scholarly and service activities. The AAUP response is to involve the contingent faculty in equivalent scholarly and service activities. Firstly, most private lesson instructors are doing this as a side gig and can’t find the time to engage in such activities.
Secondly, an institution couldn’t afford to hire full-time faculty for each instrument that students might desire to learn. A small to medium sized music department would be fortunate to have one or two student harpists. The harp is such a specialized instrument that a school would also have to be fortunate to find a harp instructor, who could also handle other string instruments. A good music student would want and seek out an institution that has an excellent specialist in his or her instrument.
Thirdly, in terms of equivalent service, particularly to the department, it has been my experience that the “regular full-time faculty” do not want “outsiders interfering with departmental business.”
Similar situations occur in other disciplines such as art, theater, physical education, and health sciences.
One final concern in looking at everything from the faculty point of view is that it is easy to lose track of the students’ points of view. In forty plus years of experience in attempting to schedule classes to fit the needs of faculty and students, I have seen many impasses. At one institution where I served, the student body was almost 60% commuters and more than 25% were working more than 20 hours per week. The full-time, tenure-track faculty was similar in makeup to the faculty from the example presented above. The students kept asking for evening classes to accommodate their personal and family situations. However, the full-time faculty refused and insisted on offering classes only between the hours of 8 AM and 4 PM. Needless to say, this institution had a serious retention problem. As word spread in the community of the inability of students to get classes when they wanted them, it also turned into a serious student recruitment problem.
There is no doubt that faculty are a necessity to the success of a college. However, for most colleges students are even more of a necessity. With the exception of a few elite colleges, the concerns of both groups must be carefully balanced.
This has been a difficult and gut-wrenching post to write. I couldn’t have planned it worse if I tried. The next higher education trainwreck post on my schedule is on Faculty Rewards and Priorities. I need a short break from these difficult topics, so I am going to take a week’s reprise from tackling that subject. My next post will return to an easier subject for me. It will be about the crazy mathematician Archimedes.
Is the world of American Higher Education coming unraveled? Image courtesy of Presenter Media.
In my most recent post A New Millennium – The Same Old Story, Part I, I introduced ten disturbances that rocked the world of American Higher Education in the 21st century. I concluded that post with the indication that my next post would continue the story with additional troubles, calamities, cataclysms, emergencies, and disasters. Here are ten more. In reality, I feel that the twenty features that I selected to spotlight in my two posts only touch the surface of the current problems plaguing American Higher Education. However, they definitely indicate the breadth and depth of the difficulties facing American Higher Education.
Numerous crises have hit AHE repeatedly and rapidly. There has been no time to rest. Image courtesy of Presenter Media.
In this post, I will follow the pattern as my previous one. I begin with a short explanation of the problem, followed by an example of a commentator or the media’s interpretation of the crisis. The list is again in chronological order according to the publication date of the article that I reference.
In 2003, Derek Bok offered a groundbreaking look at the Commercialization of Higher Education in his visionary book Universities in the Marketplace: The Commercialization of Higher Education. This tour de force asks the question: “Is everything in a university for sale if the price is right?” Bok’s answer is that the answer is too often “yes.” In today’s economy, Bok suggests that too many American universities are attempting to profit financially not only from athletics but also from those areas that touch the heart of the academy, research, and educational content.
The April 2007 Inside Higher Ed Opinion Second Thoughts About Professionalism by Jeffrey Ross paints a dark and menacing picture of the Professionalization of Education, particularly at the community college level. The first sentence of the article by Ross screams skepticism: “I’m not sure what is meant by professionalism. I suppose it has something to do with knowing what you are supposed to know on the job.” Is Ross talking about students and their education or the faculty and administrators leading our community colleges? It’s not until his fourth paragraph that he finally states “I sense that professionalism at the community college has to do with a code of behavior, a belief system, which defines how instructors and administrators should act.” Here’s where Ross and professionalism part company. He admits that “the current educator-as-professional movement…has created a somewhat misfit work culture for educators…” To describe what’s wrong with the community college culture he invokes an 18th century Jonathan Swift metaphor: “Like the learned scientists at the grand Academy of Lagado in Gulliver’s Voyages, we are focused and employed. So focused we can’t be distracted–even by the day-to-day realities of those persons whose intellectual needs we are employed to meet. So many valuable student interactions displaced by urgent meetings!” Ross calls for a new voice to speak for and lead the community college community.
The concept of Academic Freedom is considered one of the foundational principles of modern academe. The origin of academic freedom can be traced back to at least 399 B.C. when Socrates defended himself at his trial before 500 fellow Athenians against a charge of impiety and corruption of youth. He vigorously argued that the gods had bestowed on him the freedom to think. With this freedom, he was entrusted with the responsibility of the freedom to teach his thoughts. It was a duty he owed to the gods and a benefit he must confer upon the state. This idea has never been universally accepted. Socrates was found guilty and sentenced to death. The next appearance of academic freedommust wait until the 12th century when Frederick I Barbarossa, the Holy Roman Emperor, issued the writ Privilegium Scholasticum. One of its provisions protected faculty and students in their pursuit of knowledge from the intrusions of all political authorities. However, instead of creating a safe harbor for faculty and students within the halls of the University of Bologna, it fermented strife and turmoil amongst them and the Roman Catholic Church. The battles lasted for two centuries until the University formally established a School of Theology. For the next five centuries, the Church was a dominant force in the life of the University. For the first several centuries of higher education in the United States, many colleges were controlled by religious thought which limited what could be taught. In 1940 philosopher and mathematician Bertrand Russell was denied a professorial position at the City University of New York because he was “morally unfit.” This charge was primarily due to his public views on extra-marital sex, marriage, divorce, and birth control. As soon as the announcement of his appointment to the CUNY faculty became public, William Manning, a bishop of the Protestant Episcopal Church, sent a letter to the New York Times denouncing Russell as a recognized propagandist against both religion and morality. The Board withdrew its offer and the city withdrew funding for the faculty position. in 1988 Les Csorba of Accuracy in Academia claimed, “academic freedom on college campuses is nothing more than a useful device which gives license to some people and silences others”. In a December 2010 article Defining Academic Freedom in Inside Higher Ed, Cary Nelson, President of the American Association of University Professors, attempted to clear up confusion about academic freedom. He outlined a dozen points of What it does do and a dozen points of What it doesn’t do. In spite of Nelson’s article, arguments about academic freedom constantly rage both on and off campuses.
Public Support for Higher Education Is Shrinking. Tell us something we don’t already know!Since 1980 state and local financial support of higher education has dramatically decreased in multiple ways. This shrinkage is happening both in terms of real dollars and the share of support received by public colleges and universities. In a Winter 2012 report State Funding: A Race to the Bottom from the American Council on Education, Thomas Mortenson claims that if states do not change their funding patterns, by 2059, they will not be providing any support for higher education. In 2010, state and local governments spent $103.7B. This was 34.1 percent of all expenditures in the United States on higher education. This was down from its 1975 peak of 60.3 percent. Since the tax revolts of 1980, only two states, Wyoming (+2.3 percent) and North Dakota (+0.8 percent), have increased their share of higher education expenditures. Declining state support for higher education leads directly to tuition increases and a greater financial burden on students for the cost of their education.
We’ve known for years that the Cost of Regulatory Compliance is significant, but there was no real attempt to calculate it until 2014. In early 2014, Vanderbilt University’s Chancellor Nicholas Zeppos commissioned a study by the Boston Consulting Group to determine how much colleges and universities were spending to comply with federal regulations. On October 19, 2015, Melanie Moran published her preliminary summary of the results, Study estimates cost of regulatory compliance at 13 colleges and universities, online in Vanderbilt News. These results were the shot heard all around American higher education. Two of the most significant conclusions indicated that regulatory compliance represented 3 to 11 percent of higher education institutions’ nonhospital operating expenses, and that faculty and staff spend 4 to 15 percent of their time complying with federal regulations. The reaction was swift and nearly unanimous: “…compliance with federal regulations results in a significant direct and indirect financial cost.” I was not surprised by the study’s findings. In the early 1980’s I was a one-person Institutional Research Office at a small liberal arts college. I did an inventory of all the reports that we were required to complete and submit each year for various federal, state, athletic oversight groups, and accreditation agencies. There were more than 90 required annual reports. In addition to those compliance reports, I also added up the number of requests for data from outside organizations such as the Council for the Advancement of Small Colleges (CASC), American Association for University Professors (AAUP), Christian College Coalition (CCC), North American Council for Christian Admissions Professionals (NACCAP), The College Board, American College Testing (ACT), American Associations of Collegiate Registrars and Admissions Officers (AACRAO), National Association of College and University Business Officers (NACUBO), Association of Institutional Research (AIR), American Association for Higher Education (AAHE), Association of Governing Boards (AGB), and the American Council on Education (ACE). There were more than 100 such annual requests for data. The third group of reports handled by my office was data requests from advertisers such as Peterson’s Guides and Campus Life Magazine which publicized comparisons of colleges. If you didn’t comply with their data requests, they used data they “gathered” from various sources such as IPEDS and College Board. However, the institution had no control over how they interpreted or misinterpreted that data. There were at least ten such requests each year. Thus for a small college enrolling less than 800 students, to stay in “good standing” with governmental and accrediting agencies, the higher education community, and the general public, we were compelled to complete and submit more than 200 annual reports. Each of these reports easily averaged more than 10 hours of my time to verify and justify the consistency of the data. If you included the time of various offices required to compile the data, you are talking about another 20 hours each. This adds up to more than 6,000 hours of faculty, staff or administrators time per year. This is the equivalent of more than 3 full-time employees per year to handle unfunded “mandates.” Fortunately, this college was in the Middle States accrediting region. The “joke” among institutional research professionals in the early 1980s was that the proscribed accrediting and reporting requirements of the Southern Association of Schools and Colleges (SACS) were the “institutional researchers full-employment act.”
A matter of profound concern to many in American higher education for more than four decades is the Rise and Fall of Proprietary Higher Education. Prior to 1976 proprietary higher education was hardly a blip on the radar screens of higher education. That began to change in 1976 when John Sperling and John Murphy founded The University of Pheonix (UoP). The first class consisted of only eight students. By 1986 the enrollment had grown to more than 6,000. In 1994 Sperling took The Apollo Group public. By 2000 the enrollment was over 100,000 and growing by 25% per year. By 2010 proprietary institutions enrolled more than 2 million, 12 percent of all post-secondary students. Everything seemed to be coming up roses. The article The Rise and Fall of For-Profit Schoolsby James Surowiecki which appeared in the November 2, 2015 issue of THE NEW YORKER magazine paints a different picture. In those five years, UoP enrollment was cut in half. The Department of Defense removed it from its approved list for tuition payments for active duty troops. Regulatory agencies began investigating the recruitment and financial aid practices of proprietary institutions. The federal government looked closely at job-placement claims and ability of graduates to repay student loans. Proprietary institutions are now required to prove that on average, students’ loan payments will not exceed eight percent of their expected annual income. Schools that fail this test four years in a row will have their access to federal loans cut off. The implementation of this rule has effectively put a significant number of such schools out of business.
The evidence and data are clear. There are Gender and Racial Disparities, Bias, and Discrimination Within the Academy. Unfortunately, these attitudes and behaviors have been present as long as higher education has existed. More unfortunately, for many centuries, they were accepted as the norm. However, that is no longer the case. Over the past half century, there have been many small and some large steps to expose and fix these problems. In the 21st century, the pace of restructuring higher education has increased. In the case of gender disparities, a complicated paradox has emerged. One part of that paradox is illustrated in Caroline Simon’s March 8, 2017, USA Today article There’s a double gender gap in higher education–and here’s why. Simon discusses the lack of women in top leadership positions in higher education and the fact that women earn less than men in similar positions. This discrepancy at the top is in stark contrast to the fact that since 1970, the number of women students and graduates have outpaced the number of men. With more women college graduates, the question is raised about the number of women in faculty and administrative positions. There are more men at the higher faculty ranks than women, even though there are more women at the lowest faculty ranks than men. When we add in the racial component, the contrasts are much more complicated.
A July 2017 Fortune Media commentary This Economic Bubble Is Going to Wreak Havoc When It Bursts on higher education by Jim Rogers and Robert Craig Baum highlights the economic distress that the Student Debt Bubble could cause individual higher education borrowers, American higher education, and the United States economy as a whole. Rogers and Baum begin their commentary with the claim that “An imminent economic crisis the likes of which this generation has never experienced is coming…The higher education bubble (one-sixth of the U.S. economy) will likely burst with the force of all precious catastrophes combined–a shock wave so sudden, so large, that it gathers the full force of the savings and loan, insurance, energy, tech, and mortgage crashes, creating a blockbuster-level perfect storm.” They paint a grim picture of the future of AHE, suggesting that AHE leaders have no grasp of economic reality.
Natural and Man-Made Disasters Leave Indelible Effects on Colleges and Universities. Every year since 2000 there has been at least one catastrophic event that had devastating effects on American colleges, universities, and their associated personnel. However, some stand out far beyond most. In 2017, Hurricanes Harvey, Irma, and Maria pounded the island of Puerto Rica and the United States mainland. The August 28, 2018 Chronicle of Higher Education article Disaster-Stricken Colleges Will Get $63 Million in Aid From the Education Dept.by Fernanda Zamudio-Suaréz and Lindsay Ellis spotlights the U.S. Department of Education response to the resultant damage to 47 American colleges and universities. Most of the Puerto Rican institutions lost an entire year of operations in addition to the physical damage to their buildings. None of them have fully recovered their enrollments since their students and faculty scattered all over the United States. Also fresh in our memories are the western U.S. wildfires of 2017 and 2018 which affected many colleges in California and other western states. Other hurricanes, namely Katrina (2005) and Sandy (2012), caused significant damage to colleges and universities. I would also dare say that everyone in American higher education remembers where they were on the morning of September 11, 2001. The world watched in utter disbelief the tragic events of that day as the terrorists attacked the World Trade Center in New York City. Some colleges in New York were directly affected, while many in neighboring states were indirectly affected. In every year of the 21st century, some catastrophic event has affected one or more American college or university.
Jeff Selingo in his September 2018 article How the Great Recession Changed Higher Education Forever inThe Washington Post recounts the Lasting Effect of the Great Recession of 2008 on American Higher Education. The waves of troubled financial waters which swept across the worldalmost swamped American Higher Education. A number of institutions sank, drowning many students and faculty. Many of the institutions which survived attempted to lure the dwindling supply of students through their doors with a “fire sale” and huge tuition discounts. For many students the primary reason they went to college changed. Since 2008, students now see college as a means to secure better jobs, rather than a source of general education in order to be more human. This has meant an uptick in the “practical majors” such as business and health care, and a significant downturn in the humanities. A third and more subtle change occurred at the presidential and board level of colleges. Their focus shifted to more short-term survival interests, rather than long-term sustainability issues. History predicts that there will be more economic downturns in the future. However, this time American colleges and universities are less prepared to deal with these periods of famine.
Is American higher education a DIY money pit which will require a complete gut job to fix? Image courtesy of Presenter Media.
WHEW! The deeper I dug into the current difficulties and issues facing American higher education, the more problems I found, and the more complicated they became. Having done a number of extensive home remodeling or rehabilitation jobs as we moved around the country chasing new academic administrative positions, without any qualms I can say that American higher education is like a DIY money-pit. The job will always cost more than you budgeted and take longer than you first estimated. Another parallelism between American higher education concerns and DIY projects are hidden issues. When you remove a wall you are never sure what you will find beneath the plaster or the drywall. Even when you have blueprints of the house, you don’t know whether someone made previous alterations that were not documented. Are there hidden pipes and wires that will be extremely difficult to redirect? Is there mold or asbestos just waiting to catch you? Is that a load-bearing wall you want to tear out because you think it is unnecessary or undesirable? If that wall was designed to do a specific job and you don’t compensate for its removal, you run the risk of collapsing the whole building.
Trying to fix the American higher education mess is almost overwhelming. Image courtesy of Presenter Media.
Although I have found more than 10 additional problems in American higher education on which I could focus, I have decided to turn my attention to the 20 that I have already highlighted. I think you have gotten the point: American Higher Education is a Mess. My next post will look at the issue of the Adjunctification of the Faculty.
Image of the radar echos of “training thunderstorms” battering the east coast of the United States in February 2009. The image is in the public domain because it contains materials that originally came from the U.S. National Oceanic and Atmospheric Administration (NOAA), taken or made as part of an employee’s official duties. Image courtesy of NOAA and Wikimedia Commons.
In the last quarter of the 20th century, American higher education was battered unrelentingly by storm after storm. In weather terminology, meteorologists call this phenomenon “training”. This name is derived from how a train and its cars travel along a single path, the railroad track, without the track moving. With repeated precipitation hitting the same geographic area, this weather pattern often produces heavy damage caused by flooding. American higher education has been heavily damaged by a constant barrage of storms.
There is little debate concerning the results of the numerous storm trains which assailed American higher education. It left AHE in shambles. To many observers, health-wise AHE was in critical condition. The blue light was lit and the warning alarm sounded. The critical response team was called into action. The condition of American higher education had definitely reached the crisis stage. Danger lurked around every curve on every track. Educators and politicians held their breath because another potential train wreck could happen at any moment.
Photograph of the results of the December 18, 2017 Amtrak train derailment near DuPont, Washington. This image is a work of a National Transportation Safety Board employee, taken or made as part of an employee’s official duties. As a work of the U.S. federal government, all NTSB images are in the public domain in the United States. Image courtesy of the NTSB and Wikimedia Commons.
When one car derails in a train wreck, it usually takes many, if not all of the cars behind it off the rails. Since the cars are all connected, sometimes the sudden stop of a car in the middle of the train will even cause the cars in front of it to crash also. Trailing cars will pile up on the initial crashed car, scattering debris in every direction and causing much collateral damage.
With “training storms” the accumulation of the falling precipitation can eventually cause flooding. This flooding will be greatly exacerbated by the following storms, multiplying the damage. With multiple storms dumping rain on one spot, the flooding deepens at that location. It will eventually spread, affecting adjacent locations. The crisis has become a full-blown disaster.
As flood waters began to engulf American higher education, many commentators and most politicians started calling for disaster aid. They wanted some entity to act as the educational equivalent of FEMA, They were clamoring for someone to step in and rescue what they saw as a failing system. This vocal group will have to wait a long time because there is no educational equivalent of FEMA. In addition, many within higher education believe and strongly avow that the system is not failing. It is the public, along with the federal and state governments that are failing higher education.
The grass is always greener on the other side of the fence. American Higher Education was considered the gold standard to be emulated by everyone else. When gazing over a fence, you don’t always see the crabgrass in your neighbor’s lawn. Image courtesy of Presenter Media
What ended the Golden Age of American Higher Education and seriously damaged a system that was the envy of the whole world? In many accident investigations, it is difficult to identify a single event or factor that caused the mishap. Much of the time, there is a series of events or determinants that contribute to the incident. What was the series of events that caused the train wreck which derailed American higher education?
My self-identified list of the causes of rail accidents included the following items:
Human error
Environmental conditions
Mechanical failure
Infrastructure deterioration and collapse
Speed
Design flaws
Unintended obstructions
Sabotage
Combination of problems
As I have analyzed the difficulties that American higher education has faced in the last quarter of the 20th century, I believe that most, if not all of them, can be attributed to one or more items in the above list. I will use the remainder of this post to list specific events that contributed to some of the more serious disruptions during this tumultuous period in the history of American higher education. Speculation concerning the assignment of blame for those disruptions, and possibly others, will have to wait for future posts.
The first two events that led to the End of the Golden Age of American Higher Education were the end of the Vietnam and Cold Wars. These are the primary counterexamples of the axiom which states that the end of an American war produced a boom in education in the United States. What were the differences between the Vietnam war and the Cold War and other American wars?
This is a photograph of Sterling Hall taken after the 1970 explosion targeting the Army Mathematics Research Center (AMRC) at the University of Wisconsin-Madison campus. The bombing by four student radicals was in protest of the Vietnam War. The image is part of the UW Digital Collections and released to the public domain under the Creative Commons Attribution 2.0 Generic license. Image courtesy of UW Digital Collections and Wikimedia Commons.
The Vietnam War might arguably be the most unpopular war in the history of the United States. People didn’t know or didn’t believe the reasons given by politicians and military leadership as to why young American soldiers were being sent to Southeast Asia to fight and die at the hands of an unknown enemy. With a military draft in effect between 1964 and 1973, many young men used academic deferments as a means to avoid military service. The term “draft dodger” became a common insult that was hurled at these individuals.
In the late ’60s and early ’70s, young men avoiding military service swelled the enrollment ranks at many colleges and universities. They became a vocal part of the social activism that was growing up on American campuses during these turbulent years. College campuses became the hotbed of dissent not only for an antiwar movement but also for all forms of militant protests for social justice, civil rights, and alternative lifestyles.
One of the most violent protests occurred on the University of Wisconsin – Madison campus in the early morning hours of August 24, 1970. Four students detonated a bomb in a stolen truck that was parked next to Sterling Hall which housed portions of the UW-Madison Mathematics and Physics Departments, including the Army Mathematics Research Center, which was the primary target of the bomb. There were only four people in the building at the time of the explosion. A physics post-doc doing an experiment on the ground floor was killed and three others on higher floors were injured.
During Richard Nixon’s 1968 presidential campaign, he promised to eliminate the draft. However, after assuming office, this proposal was met with great opposition to the idea of an all-volunteer army from both Congress and the Department of Defense. Instead of acting immediately on his promise, Nixon appointed a commission, chaired by Thomas Gates, former Eisenhower Secretary of Defense.
President Ford announcing amnesty for draft evaders from the White House. This image is available from the United States Library of Congress’s Prints and Photographs division under the digital ID ppmsca.08536. This work is from the U.S. News & World Report collection at the Library of Congress. It is part of a collection donated to the Library of Congress. Per the deed of gift, U.S. News & World Report dedicated to the public all rights it held for the photographs in this collection upon its donation to the Library. Image courtesy of U.S. News and World Report, the Library of Congress, and Wikimedia Commons.
The Gates Commission studied the idea for a year, issuing a report in February 1970, suggesting that an adequate military force could be maintained without conscription. When the existing draft law expired in June 1971, the Department of Defense successfully argued that it needed more time to institute all of the Gates Commission’s recommendations. Congress agreed and extended the draft until June 1973. Nixon’s involvement in the Watergate scandal and his subsequent resignation on August 9, 1974, prevented him from seeing the Gates Commission recommendation put into place.
In anticipation of the end of active ground participation in Vietnam, the last draft was held in December 1972, of men born in 1952. The end of the draft contributed to a noticeable decrease in men applying to college in the mid-1970s. The last impediment for the anti-war objectors having to choose between fleeing to Canada for sanctuary or attending college for an education, in order to stay out the army, was removed on September 16, 1974. On that date, President Gerald Ford announced from the White House a complete and total amnesty for draft evaders.
A photograph of the troops on the Normandy beachhead being resupplied. Most likely taken in 1944, between June 9 and June 11. The image is in the domain since it is a work of a sailor or employee of the U.S. Navy, taken or made as part of that person’s official duties. Image courtesy of U.S. Navy and Wikimedia Commons.
In conventional wars, soldiers participated in armed conflicts and thus were unable to engage in collegiate studies. One million soldiers landed on the beaches of Normandy between June 6 and July 30, 1944. Each day, these soldiers were fully engaged in a life and death struggle, and could not have devoted any time to academic pursuits. When the armed conflicts ended, soldiers were freed to advance themselves through college studies. After WWII and subsequent wars, the various GI bills allowed veterans to enter college or career preparation programs. After WWII, almost half of the 16 million eligible veterans enrolled in some type of educational program. After the Koren War, 43% of eligible veterans used educational benefits. After the Vietnam War, an enormous 73% of eligible veterans used educational benefits. However, there were only 2.7 million eligible veterans after the Vietnam War. Thus the 73% benefit usage percentage produced just under 2 million students, compared to the almost 7.8 million after WWII and 2.1 million after the Korean War. This smaller number of actual students didn’t produce the enrollment bumps that occurred after the earlier wars.
The Cold War was a completely different kind of war. It was a battle for scientific superiority. The battlefields were the college classrooms and laboratories. The Cold War itself was a huge incentive for students to enroll in colleges and further their education. By doing so they were not only furthering the cause of their country, they were increasing their opportunities for social and financial upward mobility. The actual effect of the Cold War enrollment bump is hard to determine because it came at the same time as the last of the Baby Boomers and the first of the Gen Xers came of college age. The Gen Xers had the greatest college enrollment in American history. College enrollment of this generation of students compared to previous generations exploded.
This is a photograph of U.S. President Ronald Reagan giving a speech at the Berlin Wall, Brandenburg Gate, the Federal Republic of Germany on June 12, 1987. This work is in the public domain in the United States because it is a work prepared by an officer or employee of the United States. This media is available in the holdings of the National Archives and Records Administration, cataloged under the National Archives Identifier (NAID) 198505. Image courtesy of Reagan White House Photographs, National Archives and Records Administration, and Wikimedia Commons.
The fall of the Berlin Wall and the collapse of the Soviet Empire were emblematic of the end of the perceived Soviet threat to the American way of life. Without that driving force, the massive universities and college systems that grew up in the 50s and 60s found themselves as superfluous. The generous public support that had been so ubiquitous during the Cold War suddenly disappeared. In 1980, with the election of Ronald Reagan as President, the amount of public funding in cost-of-living adjusted dollars allocated to education started to decline for the first time in American history.
Without the immediate threat of an external enemy, the American public turned its attention to internal needs and desires. Suddenly, there were other public services competing with education for the limited available public resources. These other services included transportation and infrastructural needs, emergency services, judicial and penal services, public utilities, social and welfare services, services for an aging population, and affordable medical care. In the 1980s, with the U.S. population becoming much more concentrated in urban and suburban centers, the other services began to win more of those funds.
A comparison of the cumulative percentage increases in college costs versus the general consumer price index, 1975 to 2000. College costs extracted by the author from the Digest of Education Statistics. General CPI data extracted by the author from HIstorical Consumer Price Index Data on InflationData.com.
To appease their ravenous appetite for more of everything, without government funding, the colleges and universities turned to the next most available source of funding — their students. The total cost of college, including tuition, fees, room, and board, rose almost 400% from 1975 to 2000, while the General Cost of Living Index only rose a little over 200%. During this period college costs were rising almost twice as fast as the general cost of living.
As a bone tossed to the vulnerable students and their families, colleges increased access to financial aid. However, the overwhelming majority of these increases in financial aids were in the form of loans instead of grants and scholarships. This meant that those increased costs would have to be paid by the students sometime in the future.
With the increased availability of student loans, another problem surfaced. After students left college, whether or not they graduated, those loans came due for repayment. Another storm was brewing and another train car in danger of derailing. By the mid-1980s, students and parents had incurred nearly $10 billion in federal student loans. In 1986, more than one-quarter of all student borrowers had outstanding student loans of more than $10,000.
In 1990, the typical college student graduated with a median debt of just over $12,000. That graduate going out into the workplace could look forward to a median starting income of slightly over $43,000. This is a debt to salary ration of 28.6%. By the year 2000, the median college graduate left school with a median debt that had almost doubled to $22,500. However, the median starting salaries of college graduates had decreased by 1% to just over $40,000. This means that the debt to salary ratio had almost doubled to just over 56%. If these numbers were not shocking enough, tougher times were just around the bend.
In my next post, I will look at the continuing turmoil and disruption of American higher education that carried over into the first two decades of the 21st century. We will consider how the student debt bubble, exploding tuition costs, several recessions, proprietary institutions, and technology challenged the status quo and balance of the higher education arena.