• Skip to primary navigation
  • Skip to main content
  • Skip to primary sidebar

By's Musings

  • Home
  • Blog
  • Overview

Economics

June 7, 2017 By B. Baylis Leave a Comment

Education’s Big Lie, Part V: Every Student Is Important! No Student Should Be Forgotten!

I began this series of posts on Education’s Big Lie more than three months ago with the post Education’s Big Lie, Part I – Introduction.  In attempting to make my first point I highlighted Procrustian’s aphorism “one size fits all.”

Caricature from 19th century German satirical magazine “Berliner Wespen” (Berlin Wasps) – Title: Procrustes. Caption: Bismarck: As I see, Lady Liberty is somewhat too large – we want to change this immediately to her contention. (He chops away her legs.) – Inscription on the bed: Socialist Law. Image courtesy of Wikimedia Commons; in Public Domain

To address the question of whether the American systems of elementary, secondary and higher education are forgetting or ignoring students, I turn now to Henry David Thoreau, Albert Einstein, and Lyndon Johnson. This extremely disparate group of individuals might seem to be an unusual choice of spokespersons.

Thoreau was a 19th-century American writer and transcendental thinker. He is probably most well-known for his book “Walden; or, Life in the Woods“, a treatise on the simple life and self-sufficiency.  The key tenets of transcendentalism included the inherent goodness of nature and individuals. Followers of this world view believed that our culture, society and its institutions had corrupted the purity with which each of us was born. To return to our best, natural state, we should withdraw from society.

Henry David Thoreau, 19th-century American artist, writer and intellectual (1817 – 1862) This image is in the public domain in the United States because it was published (or registered with the U.S. Copyright Office) before January 1, 1923.

Thoreau is reported to have made the following comment concerning a child’s potential:

Do you know what you are? You are a marvel. You are unique. In all the years that have passed, there has never been another child like you. Your legs, your arms, your clever fingers, the way you move. You may become a Shakespeare, a Michelangelo, a Beethoven. You have the capacity for anything.

I picked Thoreau because he could see the future in the eyes of a child playing with a jar of paint. Most people only see the child making a mess. To Thoreau, that child was envisioning a masterpiece on the epic scale of the Sistine Chapel.

This photo of a baby playing with yellow paint by Dutch artist Peter Klashorst is entitled “Experimental”. Image courtesy of Peter Klashorst and Wikimedia Commons. It is licensed under the Creative Commons Attribution 2.0 Generic license.

In December 1999, Time Magazine named Albert Einstein the Person of the Century. The editors proclaimed him to be a “genius, political refugee, humanitarian, locksmith of the mysteries of the atom and the universe.” They further explained their somewhat controversial choice by saying, “He was the pre-eminent scientist in a century dominated by science. The touchstones of the era–the Bomb, the Big Bang, quantum physics and electronics–all bear his imprint.”

Albert Einstein German-American scientist (1879 – 1955), lecturing in Vienna in 1921, the year he won the Nobel Prize in Physics. Photo by Ferdinand Schmutzer. Image in Public Domain, via Wikimedia Commons”

Einstein often spoke of the importance and significance of the individual. The following quote is generally attributed to him: manner:

The person who follows the crowd will usually go no further than the crowd. The person who walks alone is likely to find himself in places no one has ever seen before.

Solitary hiker on virgin snow. The photo was taken March 23, 2014, by Tapas Biswas near Sandakphu, West Bengal’s highest peak. The image is licensed by Biswas under the Creative Commons Attribution-Share Alike 4.0 International license. Image courtesy of Tapas Biswas and Wikimedia Commons.

I picked Einstein and this quote denigrating the process of following the masses because Einstein was a person who set out on his own most of his life. He separated himself from the crowd and concentrated his attention on what he saw, heard and thought. These were things that people who took the shoveled path never saw.

Lyndon Johnson was elected Vice President of the United States in 1960 when John Kennedy won the presidency over Richard Nixon. When Kennedy was assassinated in 1963, Johnson became the 36th President of the United States. Under Johnson’s leadership, a series of domestic legislative programs called the Great Society and the War on Poverty were enacted. They included Medicare and Medicaid, and a significant increase in federal spending on education, the arts, urban and rural development, and public services. There was also a dramatic increase in governmental attention to the civil rights of individuals.

The signing ceremony on April 11, 1965, for the Elementary and Secondary Education Act (ESEA) at the Former Junction Elementary School in Johnson City, Texas. Lyndon B. Johnson is seated at a table with his childhood schoolteacher, Ms. Kate Deadrich Loney. The President took the opportunity to deliver prepared remarks about educating American youth. This image is the work of Frank Wolfe, White House photographer, an employee of the Executive Office of the President of the United States, taken or made as part of that person’s official duties. As a  work of the U. S. federal government, the image is in the public domain.  Image courtesy of Wikimedia Commons.

In President’s Johnson prepared remarks he said,

By passing this bill, we bridge the gap between helplessness and hope for more than five million educationally deprived children.

We put into the hands of our youth more than 30 million new books, and into many of our schools their first libraries.

We reduce the terrible time lag in bringing new teaching techniques into the nation’s classrooms.

We strengthen state and local agencies which bear the burden and the challenge of better education.

And we rekindle the revolution–the revolution of the spirit against the tyranny of ignorance.

As a son of a tenant farmer, I know that education is the only valid passport from poverty.

As a former teacher–and, I hope, a future one–I have great expectations of what this law will mean for all of our young people.

As President of the United States, I believe deeply no law I have signed or will ever sign means more to the future of America.

To each and everyone who contributed to this day, the nation is indebted.

What an awesome responsibility to place on one law:

  • Bridge the gap between helplessness and hope
  • Put new books and libraries in our nation’s schools
  • Reduce the time lag in bringing new teaching techniques into our classrooms
  • Rekindle the revolution against the tyranny of ignorance
  • Provide a valid passport from poverty
  • Give young people great expectations for their futures

In the half a century since ESEA was signed into law, there have been a few victories. One of the first to occur in the late 1960’s was the concept of magnet schools. These schools were introduced as an educational reform model of public school choice as a way to address educational inequity.   Magnet schools are based on the premise that students do not learn in the same way or at the same rate; that if we find a unifying theme or a different organizational structure for students of similar interest, students will learn more in all areas. In other words, if a magnet school voluntarily attracts students and teachers, it will succeed because, more than for any other reason, those in attendance want to be there. They will have chosen that school.  These schools usually have superior facilities and staff and offer a specialized curriculum designed to attract pupils from any school throughout a city or district.  Magnet schools have been created centered around STEM fields, the arts, and the classics.

Students at Parkland Aero Technology Magnet School in Rockville, MD are shown using a  device called a Sunspotter to track sunspots. Talking to the students is Research Scientist Daniel Mueller. He is explaining what they are seeing. Mueller from the European Space Agency is working with the Solar and Heliosphere Observatory (SOHO) of NASA. The photograph was taken in June 2016 by a NASA employee. This image is in the public domain in the United States because it was solely created by NASA. Image courtesy of NASA and Wikimedia Commons.


This is the art gallery of Da Vinci Arts Middle School, an arts magnet school in the Portland, Oregon.  The photograph was taken in January 2016 by Margalob. This image is licensed under the Creative Commons Attribution-Share Alike 4.0 International license.  Image courtesy of Margalob and Wikimedia Commons.

A number of school districts have been very successful at putting new books and new technologies into libraries and the hands of our students.  For example, the Port Charlotte school district on the Gulf Coast of Florida, approximately half way between Sarasota and Fort Myers, has a new combination library and media center that rivals many college facilities in its equipment and attractiveness.  Its mission reflects the goals of President Johnson and the EASA legislation.

 The Mission of the Port Charlotte High School Media Center is to encourage our students to develop a love of reading, to appreciate the many kinds of literature available, and to ensure that students become effective users of ideas and information.  We aim to provide a comprehensive program of service, print and non-print materials, equipment and technology that will help meet the students’ academic and leisure needs.  Our resources and instruction support the educational goals of Port Charlotte High School.

Port Charlotte High School Media Center in Port Charlotte, Florida. This image was posted to Wikimedia Commons by its author, identified as PCHS-NJROTC, on May 12, 2010,  It is licensed under the Creative Commons Attribution-Share Alike 3.0 Unported license. Image courtesy of PCHS-NJROTC and Wikimedia Commons.

Before we get too excited and get the idea that most public school libraries look like this, we must take note that Port Charlotte is a wealthy suburban district where the median price of homes in mid-2017 is over $235,000. It was ranked as the 15th best public school district in Florida by NICHE, a small firm that is comprised of data scientists, engineers, and parents, who are passionate about helping people discover the schools and neighborhoods that are right for them and their children. The total 2016 fiscal year budget for the Port Charlotte School District was $247million, of which $30million was appropriated for capital improvement projects.

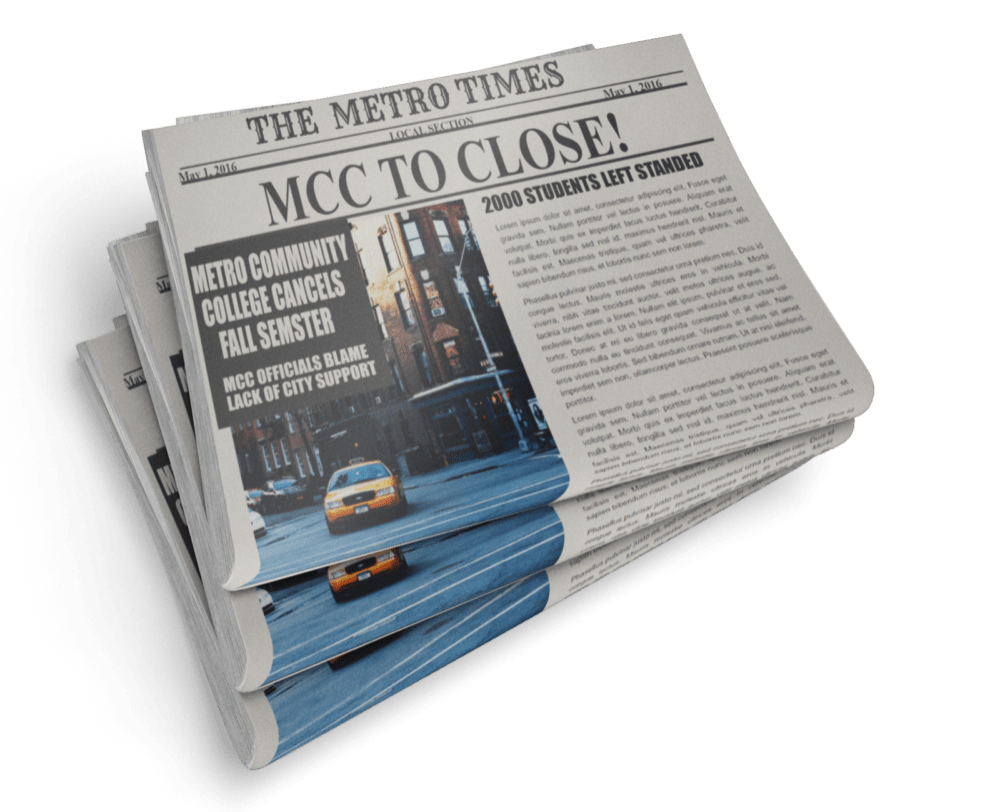
There are many other successful school districts across the United States. However, the failures have far outnumbered the successes. To find examples of these failures, all one has to do is read the daily or weekly news reports coming out of Washington and many other cities and towns around the United States. In my next post, I will highlight some of those failures. Having been a participant in and observer of education for more than 65 years, I have seen at least six types of students who have been and are being ignored by American public K-12 education as a system and by individual teachers within the system. In subsequent posts, I will highlight these types of students and make some suggestions concerning what I believe needs to be done to bring these students into the mainstream.

Filed Under: Education, Teaching and Learning Tagged With: Community Activism, Economics, History, Student, Technology

September 10, 2016 By B. Baylis Leave a Comment

Broken Business Model of American Higher Education, Part VI: Incremental Growth Will Not Be Enough

courtesy of Presenter Media

I am finally returning to my series on the broken business model of American higher education. In previous installments of this series, I have indicated that I believe the sprawling educational multiplex on which the United States relies and to which much of the world admiringly looks for leadership is sputtering and struggling to catch its breath, I think  American higher education is caught between a rock and a hard place. I am convinced that it has reached an important fork in its road. Which way should we go? The future prosperity of American higher education is potentially at stake.

I suspect many of you are cringing at my use of the word prosperity with respect to higher education. I intentially used the business term “prosperity” in this context. I can hear people screaming at their computer screens: “Higher education is not a business.” Folks, other than in the form of a vigorous denial, you won’t hear that expression from me. I’ve said it before, and I’ll say it again: “Higher education is a business.” See my previous post, According to the Duck Test, Higher Education is a Business. If you see an animal in the barnyard that has feathers like a duck, flies like a duck, waddles like a duck, quacks like a duck, swims like a duck, and looks like a duck, then it is a very safe bet that it is a duck.

courtesy of Presenter Media

I believe that much of the difficulty and confusion comes from the fact that education is more than a business. In addition to being required to operate as a business, it is a ministry, an agency of  service to individuals, communities, our country and the world. It provides a public and private good. It offers aid, assistance, help and utility. I put it in the same pigeon hole as the fields of medicine, and charitable service enterprises. All of these enterprises offer indispensable assistance and benefits to their clients, communities and the human race. I have heard many call for these initiatives to be held to higher standards of accountability than we demand of the companies from which we obtain our meals and groceries. We seem to have far fewer problems with businesses offering inferior services to customers or clients, than requiring service organizations to maintain their obligations to operate according to the legal requirements that all businesses are suppose to meet.

courtesy of Presenter Media

The past several postings in this series have been about growing enrollment. I believe that American higher education has reached a point of decision at which it must pick between two very different paths. This choice will define unique and important historical options that will have far reaching consequences. If you are completely turned off by the idea that higher education should be described in business and economic terms, will you allow me to use the medical analogy of the health of American higher education?  Have we reached a point where the future health of American higher education may conceivably be at stake? Is it time to check its temperature, heart rhythm,  AIC, cholesterol levels, BMI and the electrical activity of the brain?

courtesy of Presenter Media

Most educational pundits, critics and commentators, friendly or otherwise, readily admit that American higher education has come through some very trying times and will definitely face some more problems, and possibly even crises in its immediate future. The decisions that American higher education must make can be formulated in a number of different terms. The problems facing American higher education are complex and multifaceted. This means that we must be prepared to wade through knee-deep, involved puddles of mud to get close to understanding the problem before we can formulate and begin to implement a remedy that will alleviate the current difficulties.

From previous posts in this series, I have tried to present the argument that American higher education is facing financial problems and pressures. The enterprise doesn’t have enough money to do what it’s currently doing. It is also far short of having the funds to do what it and seemingly most of the American public wants it to do. In this series I have proposed that American higher education has five sources of revenue. In the first post of the series, The Business Model of All of Higher Education is Broken, I listed five possible sources of revenue for American higher education:

  1. Tuition and fees;
  2. Fundraising, advancement or development efforts;
  3. Endowment income, appreciation, interest or dividends;
  4. Auxiliary enterprises; and
  5. Government appropriations (Reserved for public institutions).

Previously in this series, I have concentrated on revenues from tuition and fees. The two easiest ways to enlarge this revenue pot are either by increasing the tuition and fees charged each student, or by growing enrollment, i.e., increasing the number of students paying the tuition and fees. I have attempted to show that institutions would be fighting a losing battle if they attempted to increase the tuition and fee charges sufficiently to cover their current needs or future desires. Student, families, politicians and the general public already believe that tuition and fees are too high. In the most recent post in this series, The Business Model of All of Higher Education is Broken, Part V: Increasing Enrollments is Not Enough, I began to consider the difficulties in increasing enrollments to gain more revenue. I continue that line of reasoning in this post.

Business strategists, economists and mathematicians typically talk about two types of growth: incremental and exponential. Incremental growth is normally represented on a graph by a straight line. With this type of  growth, the number grows by approximately the same amount in each period of time. Its graph is best approximated by a linear function. On the other hand, exponential growth is an upward-opening, concave curved line.  In exponential growth, the number grows at a rate that is proportional to the number’s current value, resulting in its growth with time being an exponential function. Its graph is best approximated by an exponential function, with a leading exponent of the independent variable equal to 2 or greater. To illustrate the difference, consider the following fabricated example of college enrollments in a fictitious country.

Enrollment in fictitious country to illustrate the problems with incremental growth. Chart created by author using Google Sheets

The graph begins at a point in the history of our fictitious country where the current enrollment is 20 million students. If our country does nothing different year after year, the enrollment would tend to stay constant (bright green line on the graph). The incremental growth graph (red line) is approximated by a straight line with a slope of positive 1. This means that for each year, the enrollment grows by 1 million students.. The exponential growth graph (blue line) is approximated by a quadratic function.  The quadratic growth model represents a disruptive change, such as switching to online degree programs,  which at first causes a slight decline in enrollment before the exponential growth kicks in. Our Combination Model  (the purple line) represents a combination of adding the online program plus the incremental growth from adding students to the traditional programs.

The enrollment numbers for this fictitious country are not completely unimaginable. The current enrollment in the United States is approximately 20 million. According to the Institute of Education Sciences (IES) of the National Center of Education Statistics (NCES), it is expected to growth by almost 5 million students in the next 5 years. For the first 200 years of American higher education, enrollment did double approximately every 10 to 15 years. If you dig into those statistics you will find that those staggering enrollment increases followed disruptive changes in American society and higher education. There were earth shaking events and government reforms that contributed mightily to  the enrollment growths. The slow down and eventual leveling off enrollment growths of the past half century would require new earth shaking events or changes to American higher education to put it back on the path to doubling enrollment every 10 to 15 years. However, this growth is exactly what political and educational pundits desire and suggest that American society must have. We have both presidential candidates of the major political parties suggesting that the economic recovery of the United States must be built on the backs of high tech jobs and increased educational opportunities. Both have suggested that we must double the number of college graduates in the next decade. I only see two ways to double the number of graduates in the next decade. FIrstly, we must either improve our college completion rate from approximately 50% to essentially 100%. We haven’t really come close to that goal with high school education and look at all the flak that secondary education is receiving over graduating unprepared students. The second approach is to essentially double the number of students entering college. For my response to this, see my first point.

from Presenter Media

However, it is not just Americans crying for these increases in higher education enrollments. You have Education Dive’s headline of August 12 blaring out College enrollments to double in next decade. I invite you read this article for yourself and follow the leads in the article to their sources. It is not a pretty picture the author, Jarrett Carter, is painting concerning American higher education. What’s American higher education to do? As with any work of suspense, I break off my story with our hero hanging by his fingers from the edge of the cliff and leave the resolution for another installment. Please stay tuned.

Filed Under: Business and Economics, Higher Education, Politics Tagged With: College, Economics, Enrollment, Graduation, Student

August 3, 2016 By B. Baylis Leave a Comment

The Business Model of All of Higher Education is Broken — Part IV Tuition and Fees

from Presentation Media

This is the fourth part in a series on the economic conditions in higher education. The preceding post, The Business Model of All of Higher Education is Broken: Part III — Tuition and Fees, dealt with the history of the revenue stream generated by tuition and fees over the past 40 years. American higher education is divided into two main segments: public education and private education. Much of the American population has a giant misconception about how American higher education is funded. Most students and their families know full well the real financial burden that an education puts on their own budgets. However, it seems that many Americans believe that between government subsidies and the revenues generated by tuition and fees, both public and private colleges cover all of the educationally related  expenditures of these colleges. Most surveys suggest that the American population does not believe that American higher education is experiencing a real financial squeeze. On the other hand, surveys such as Inside Higher Ed’s Annual Survey of Chief Business Officers, tell a very different story. More college officials are starting to worry about the future of American higher education. While this debate rages, some current politicians are espousing the idea that the public institutions should be tuition free. Many independent analyses of this idea suggest that there are untold, hidden dangers in this bold plan. It looks like I just suggested the addition of at least two more posts to this series on The Business Model of All of Higher Education.

from Presentation Media

However, as promised this post will concentrate on the question of how much of college budgets are actually covered by students’ tuition and fees. The most recent compendium of cost data is from the January 2016 Delta Cost Project, at the American Institutes for Research (AIR), Trends in College Spending: 2003 – 2013.  This report is the most recent in a series of reports sponsored by the American Institutes for Research (AIR). These reports focused on two questions: 1) Revenues: Where Does the Money Come From? and 2) Expenditures: Where Does It Go? What Does It Buy?  In addition to the Delta Cost Project, expenditure data can be extracted from the Integrated Postsecondary Educational Data System (IPEDS) data base. Unfortunately, the Delta and IPEDS data do not segment their data in the same manner. In addition, the Delta study has not consistently used the same segmentation.

Data exacted from Delta Costs Studies and IPEDS data base; supplemented by author’s calculations

The Delta Study prior to 2013 used only six segments of institutions. There were three for public institutions: Research Universities, Master’s Universities, and Community Colleges. The three private categories were: Research Universities, Master’s Universities, and Bachelor’s Colleges. In 2013, the Delta Study added a seventh segment: Public Bachelor’s Colleges. In attempting to extract the data from the IPEDS data base, one must be careful because some college and university systems submitted data for individual institutions, while others submitted system-wide data. In using the IPEDS data for this post, I tried to break down data into seven segments. I can’t guarantee the absolute accuracy of all of my calculations. However, since the data seemed to fall in line with the Delta data, I am comfortable in using my data for general inferences.

There are at least four mysteries or questions that we can derive from the data in the chart above. The first is that the private institutions use more of tuition dollars to pay for Education and Related Costs (E&R Costs). This is not totally unexpected since public institutions by definition get more support from governmental sources. There is another question lurking in the weeds. The graph of E&R Costs for private institutions are much closer to flat lines than the more sharply increasing lines for public institutions. What are the causes of these sharp increases? Is this a subject for another post?

from Presenter Media

In terms of funding for Public Institutions of Higher Education (IHEs), federal and state politicians have been passing the football back and forth like a hot potato for the past quarter of a century. After many years of stability or growth, the percentage of total spending at state universities provided by state tax revenue has been sinking since 1990. In attempting to explain drastic increases in tuition and fees for Michigan residents, Jim Duderstadt, President of the University of Michigan from 1988 to 1996, told students, state legislators and the general public, “We used to be state-supported, then state-assisted, and now we are state-located.” In the Commonwealth of Pennsylvania, the State System of Higher Education is comprised of 14 “state owned” universities. The state contributes $3,900 annually per student while in-state students pay $10,052 annually in tuition and fees. For the state-supported, flagship institution Penn State University, in-state students pay $17,514 in tuition and fess while the state contributes $3,000.  Michigan and Pennsylvania are not the only two states that have “privatizing public higher education.” Thomas G. Mortenson began a Winter 2012 post, State Funding: A Race to the Bottom, on the American Council on Education (ACE) website on the Leadership and Advocacy page with the following statements:

State appropriations for public higher education have just faced another tough year. And yet, public institutions have faced many such years over the past three decades. Despite steadily growing student demand for higher education since the mid-1970s, state fiscal investment in higher education has been in retreat in the states since about 1980.

In fact, it is headed for zero.

Based on the trends since 1980, average state fiscal support for higher education will reach zero by 2059, although it could happen much sooner in some states and later in others.

I have one question for all the zealous politicians calling for tuition-free, or even debt-free public education: “Flying in the face of these current trends, where are you going to get the money to make up these differences?”  These conundrums sound like the material for additional posts.

from Presenter Media

The second question raised by the chart, Tuition’s Share of Education & Related Costs,  relates to the percentage of student tuition dollars that Private Master’s institutions devote to E&R Costs. These data help bring to light one of the most poorly kept secrets in higher education. Master’s programs can be cash cows for institutions. Traditionally, many master’s degree programs, such as MBA’s, MED’s, and MA’s in humanities, have not given out large amounts of financial aid to students. Master’s degree students in these areas come to the institutions without any expectation of financial aid from the institution, nor from current employers, if they have current employers. Thus, they tend to pay full tuition out of their own pockets, using loans to make up any differences they can’t fund out of their own savings and earnings. This frees up more money from the subsidy sources for institutions to use in other ways. Do these points provide us topics for additional posts?

The third question relates to three obvious declines in the percentage of student tuition dollars used to fund E&R Costs in the above data. The first two occurred in 2003 in the Private Research and Private Master’s universities. There are also drops in the Private Bachelor’s colleges and Public Master’s universities. These occurred in 2004 and 2006 respectively. This question has two parts. The first part is “Why did institutions decrease their dependence on student tuition dollars?” The second part is “Why did these declines occur at different times?”

The fourth mystery relates to the relative slope of the graphs of the public institutions. The Public Community Colleges have the slowest growth rate of all public institutions. Why have they been able to keep from dipping into the student tuition dollars to fund more of the E&R Costs? Do they know something or are they doing something different from the public four-year institutions?  Is this a topic for another post?

I believe that I have come to a good transition point in this discussion of Tuition and Fees providing additional funds for American colleges. If we can’t raise what each student pays, the next logical choice would be to get more students paying the base tuition and fees. The next post will deal with the problems of increasing the number of paying students going to college.


Filed Under: Business and Economics, Higher Education Tagged With: Budget, College, Economics, Subsidy, Tuition

July 18, 2016 By B. Baylis Leave a Comment

The Business Model of All of Higher Education Is Broken, Part III – Tuition and Fees

from Presenter Media

In this current post, I return to the discussion of the Business Model of All of Higher Education. In a previous post, The Business Model of All of Higher Education Is Broken,  I introduced the five sources of revenue for Institutions of Higher Educations(IHEs): 1) Tuition and fees; 2) Fundraising, advancement and development efforts; 3) Endowment income, appreciation, interest and dividends; 4) Auxiliary enterprises; and 5) Governmental appropriations. In this post, I had originally planned to consider all of those sources of revenue in one post. However as I began to work with that idea, I found the explanations growing too large for one post. In addition, no matter how hard I cranked the revenue generating machine for each revenue source in an attempt to create additional funds, I discovered that increasing the effort in any given area did not produce a commensurate return on investment (ROI). Therefore, I decided that I needed to expend more time and coverage in this series to each source of revenue to give it the analysis I felt it deserved.  Thus, I have decided that I will begin to plan to cover each of the revenue sources individually in separate posts. As I get into the ins and outs of the revenue source, I may have to add more posts. I begin this process with the source of revenue with which all students and their families are most familiar, Tuition and Fees . It is also the revenue source that the general public most clearly associates with Institutions of Higher Education (IHEs).

from Presenter Media

The revenue from tuition and fees obviously depends upon enrollment. This means that there are really only five ways to increase the useable revenue from tuition and fee. These five possibilities are:

  1. increase the tuition and fees, thus increasing the base amount each student pays;
  2. increase the number of students paying the tuition and fees, i.e, increase tuition-paying enrollment;
  3. decrease the discount rate on tuition, thus decreasing the average amount of institutional financial aid given to enrolled students;
  4. change the model of teaching and learning in order to increase the efficiency of the use of this revenue stream;
  5. do a combination of two or more of the above at the same time.

With points 3 and 4 above, I apologize for sneaking the expenditure side of the business model into the conversation. However, much of the general public acts as if it believes that tuition and fees cover the cost of a college education. This is definitely not the case, and has not been the case since the beginning of formal American higher education in the mid-17th century. Since this rabbit trail would take us deep into the expense side of the budgets of IHEs, I will leave the exploration of this topic to another post. I will devote the remainder of this post to just addressing the issue of increasing tuition and fees. I will cover the problems of increasing the number of students, decreasing the discount rate and changing the model of teaching and learning in additional posts.  I will also address the four other IHE revenue sources in additional posts.

from Presenter Media

When IHEs announce tuition increases each spring for the following fall, it is usually met with varying degrees of disdain. Students, parents, the general public, as well as federal and state governments are already enraged at the current level of tuition and fees. The data are clear. Tuition and fees have increased at rates exceeding the annual general inflation rate for years. Just at the suggestion of another increase, the reaction varies. It runs the gamut from a reluctant acceptance to a loud murmur to a campus uproar and rebellion.

The following three charts use the same data extracted from the College Board Pricing Trends, which has the most comprehensive collection of data on college pricing trends. Although the charts are based on the same data, they give us three different pictures of the history of Tuition and Fee Increases over the past 40 years. Why have I chosen to present this information in three ways? It is to try to help my readers understand that there are different ways to look at the same data and that one’s first impression may not be the only or best way to view the subject.

The first chart is a 40-year history of tuition and fee increases in “current  dollars,” i.e, the average list price of tuition and fees for all colleges in a given segment weighted by full-time undergraduate enrollment. These list prices are compared against the 40-year average increase in list prices. The current dollar tuition and fees are the prices that students, their parents, and government officials will see first. These are the dollar figures against which everyone reacts. The first impression from the graph is how similar the tuition and fees were for all three segments in 1975. Based on the scale of this graph, it is almost impossible to distinguish the price of the four-year, public institutions and the two-year, public institutions. Although the private, four-year institutions were more expensive, on the scale of this graph, in 1975 they did not appear “that much more expensive.”

CHART 1: History of Tuition and Fee Increases Compared Against 40-Year Average Annual Increases

The second impression that this graph conveys to me relates to how the actual increases fall below the projected increases based upon the 40-year average annual increase. This means that the early increases were less than the average annual increases and it took quite awhile for the actual increases to catch up with the average annual increases. It appears that the sharp increases in both public and private four-year schools occurred in the period from 2000 to 2010.  This would coincide with decreased support from government appropriations for financial aid.

This graph clearly gives the impression that the gap between the three segments has grown significantly. This is the feeling that students and their parents get when they start looking at colleges and the tuition prices. The fourth and fifth impressions that this graph gives me revolve around the two-year public institutions. The first of these impressions is how much more affordable this choice seems compared to the other two choices. The second impression is how close to a straight line the actual increases appear. To me, and many other commentators and critics of higher education,  this raises the spectre of whether these institutions “know the secret” for holding down tuition increases.

The two primary conclusions that many will draw from this graph are: 1) the two-year, public institutions are the most affordable choice for an education; and 2) the four-year, private institutions have had uncontrollable tuition increases over the past 40 years.

The second graph, entitled Growth Factors of Tuition and Fees from 1975 to 2015 Across College Segments, Selected Academic Years, portrays the same data that the first graph did, but gives a very different slant to that data. This chart tells us how fast tuition and fees grew. Surprisingly, it says that the time to double has been relatively constant. In rough terms throughout the 40 years from 1975 to 2015, it has generally taken 15 years for tuition in any of the college segments to double.

CHART 2: 40 Years of Tuition and Fee Growth Factors

SInce the blue bars representing the public, two-year institutions increase in height the most consistently, this is another verification of the steady, almost constant rate of growth of tuition and fees for the colleges in this segment. During the first 20 years, I find it very interesting to note that the public, two-year institutions increased their tuition and fees at the fastest rate, while public, four-year institutions at the slowest rate. In the second half of the 40-year period, the growth rate of public and private four-year institutions shot up, far out stripping the two-year public institutions. Does this represent a shift in public funding priorities for higher education?

Although the growth factors were very close since the private four-year institutions started out with higher tuition and fees, doubling the higher rate increased the differential. Thus, the actual dollar spread in tuition did indeed produce growth.Two different graphs give you two different pictures.

The third graph is entitled the Five-Year Percentage Changes in Tuition and Fees Across College Segments, From 1975 to 2015. This graph plots the percentage change in tuition and fees over five-year periods from 1975 to 2015. This graph gives one a very different picture of tuition and fee increases over these 40 years.  The overall trend of data points in this graph are actually decreasing. This doesn’t say that tuition and fees are decreasing. What it says is that the rate of change is slowing.

CHART 3: Five-Year Percentage Change in Tuitions and Fees, 1975 to 2015

Looking at the three different sets of points and lines joining those points, it is not surprising that the blue points representing the two-year, public institutions show the least variation. That confirms what we have seen in the other two graphs. The red points show the most variation away from a straight, decreasing line. The four-year, public institutions have been the institutions most affected by the whims of state legislatures or governors. Again, even though the rate of increase for private, four-year institutions is slowing down, don’t look for the public, four-year institutions to catch them in list price anytime in the near future.

Chart 1 hit me right between the eyes. To those who can remember, I challenge you to go back to your college days and put your tuition and fees into an appropriate year in the chart. For some of us we will have to add lines at the beginning of the chart. My experience would extend the chart another 10 years to the left. In the early sixties at the flagship university in a small state, I never paid more than $175.00 annual tuition plus $10 lab fees per science course, which usually added $20 or $30 per semester. Since computers were just coming into use, as a mathematics and physics major I had to pay a $25 per semester technology fee for the right to put my card decks in the hopper each night and come back the next morning to get the print out from the pin-fed line printer. In addition, as a commuter, I had to pay $50 per semester for a “hunting license” to try to find a parking space in an on-campus parking lot. Thus, my total annual tuition and fees bills were less than $550. My textbooks and supplies were less than $150 per semester. I lived at home, and my mother never charged me anything for room and board, because I took care of everything around the house since my father died during my freshmen year in college. Gasoline averaged about $0.30 per gallon, and I spent maybe $10.00 per week to keep my car in gas, and $25 per week for coffee and lunches. Thus, my total out-of-pocket expenses to go to college were less than $2000 per year, or $8000 for my entire undergraduate education. If you subtract the $6000 in scholarships that I won or was awarded, my B.S. degree in mathematics cost me less than $2000 out of pocket. Even in early 1960 dollars, that was entirely possible to pay for out of summer or part-time school year earnings. For my four years in graduate school, I had a fellowship that paid tuition and living expenses. I didn’t pay one nickel out of pocket for my Ph.D. I graduated in eight years of schooling, with a B.S. and a Ph.D.in mathematics, with a wife, a child, a house, two cars, money in the bank, NO DEBT, and an offer of a tenure track job! In today’s world that would be definitely an anomaly. According to CNN, for the most recent year for which data is available, the undergraduates of the class of 2013 walked off the commencement stage with an average debt of $35,200, while Ph.D. graduates “stumbled” off the platform with an average debt of $57,600. Among Ph.D.s, more than 28% had debts of more than $100,000. The average J.D. and M.D. graduating from Law School and Medical School respectively, had a debt of more than $140,000. Much has been written and debated about the debt bubble that has overtaken or is overtaking American higher education. It looks like I have created at least one more blog post on the Debt Bubble.

from Presenter Media

Why does this picture look so bleak? I believe it looks bleak because we could be on the verge of very bleak times for higher education. American higher education is heading for a perfect storm, unless it changes course or one or more components of the storm change direction. A perfect storm is the confluence of events which individually may not necessarily be dangerous, but the combination of these events creates a potentially disastrous situation. Here, too, I am taking you to the suspenseful edge, and leaving you to dangle. The perfect storm will be another post in this series on the broken business model of American Higher Education.

http://www.hamiltonproject.org/assets/legacy/images/uploads/thp_image_uploads/charts/college_cost_large.png#college%20cost%20chart%20520×520


Filed Under: Business and Economics, Higher Education, Politics Tagged With: Auxiliary Enterprises, Bubble, Business, Business Model, Debt, Economics, Endowment, Expenditure, Fundraising, Ministry, Return on Investment (ROI), Revenue, Service, Systemic Thinking, Tuition

June 5, 2016 By B. Baylis Leave a Comment

Higher Education and Toilet Paper, Part II

from Presenter Media

This is the first of several follow-up posts to the posts What does higher education have in common with the watch industry, the chocolate industry and toilet paper manufacturers? and Comparison of American Higher Education with the American Automotive Industry that I published six years ago. I have been thinking about reprising the idea after seeing the YouTube video, HoboTraveler.com The AskAndy Show, about toilet paper with no center core. Although Kimberly-Clarke introduced the “Natural Roll”  under the Scott Brand name about 8 years ago with much fanfare as to how it was going to reduce landfill, incinerator and recycling waste in the United States, it seems to be a colossal flop here, but it has caught on in Europe and Asia. Witness the following U.K. news article from 2014, Roll with the times: U.S. company takes the cardboard OUT of toilet paper for first time in a century in move to cut down on waste.

In the initial roll-out of the tubeless toilet paper, Kimberley-Clarke indicated that approximately 17 billion rolls are used world-wide, each year. That would be enough to fill the Empire State Building twice. Placed end-to-end, this many rolls would stretch around the Earth at the equator 40 times. They also represent 160 million pounds of waste, roughly equal to the weight of 250 Boeing 747s.  In an effort to encourage the use of the core-less toilet paper rolls, ScottBrand has published the following website for consumers to estimate how many rolls their families would typically use: How many tubes do you use?

Why would the core-less roll find a burgeoning market in Europe and Asia, but not in the U.S.? There is probably no one answer. Most likely, it is a combination of a number of factors. Most US consumers give lip service to going “green.” However, if it costs more or is a little less convenient, the US consumer seems to stick to the old way of doing things. Consider recent pushes for light bulb, battery and electronic equipment recycling.  In Asia and Europe, particularly Eastern Europe, consumer products are far more controled by central government decisions.

What’s all this have to do with higher education? Let’s go back to the 1890s when toilet paper rolls were introduced. Toilet paper rolls were a new convenient way to provide a sanitary way for people to clean themselves after the elimination of bodily waste. They didn’t catch on right away. Their use skyrocketed with the almost universal introduction of indoor plumbing, community sewer systems, and private septic systems that were built on the premise of the disposal of only biodegradable products.

www.madblog.org/2011/09/an-unexpected-catalyst-the-gi-bill/

Prior to the return of soldiers from World War II and the introduction of the educational benefits contained in the G.I. Bill (or Servicemen’s Readjustment  Act of 1944), American colleges could be divided into three models. The first model was the small, quintessential residential liberal arts college. The second model was the land grant college that grew out of the 1862 and 1890 Morrill Acts. These IHEs tended to be larger schools that emphasized agricultural education and research, and community service outreach programming. The third model was born out of the European research-based educational institutions that began in the US, around the turn of the 20th century, with the flourishing of the Ivy League institutions and the birth and growth of the University of Chicago and Stanford University.  With millions of servicemen and women looking for educational opportunities in the latter half of the 1940s and the first half of the 1950s, the existing IHEs didn’t have the capacity to handle such a load.

One very surprising solution to this overcrowding was the unexpected growth of for-profit institutions in the late 1940’s. Many of these institutions were labeled “fly-by-night” schools at the time. Sound familiar? There was a two pronged approach to tackling the problems created by these schools. The first was to increase restrictions by the federal government and accrediting agencies. Sound familiar, again? The second was the unprecedented expansion in the latter half of the 20th century of existing traditional colleges and universities in terms of enrollments, programs and facilities. These expansions created a secondary market demand for an increased number of faculty, which further drove the expansion of graduate programs. Since the early 1990s, the job prospects, in and out of academia, of recent doctoral graduates in almost all disciplines have tanked. In many disciplines we now have a surplus of PhDs. What are we going to do with all of them?

from Presenter Media

As all of this has been happening, there has been call after call for more education. Politician after politician has pushed for more college graduates to meet the unmet demand for qualified job applicants. To meet these demands, American society has turned to three sources. The first has been for-profit institutions, that many accuse of operating unethically. Sound familiar? The second source is an explosion of non-traditional programs emanating from the traditional IHEs. If you can’t beat them, you might as well join them. The number of traditional IHEs with “adult educational programming,” online programs and even MOOCs has exploded. The third has been pressure from multiple sources on the traditional IHEs to be “more efficient” in their traditional programming. Everyone has THE SOLUTION.

However, when we try to partially implement these solutions, the situation seems to get worse. Enrollment in higher education has reached an all-time high. However, so has the number of attriters who enrolled in programs but don’t complete them. The level of borrowing for education has reached all-time highs, as has the number of defaults. As more under-prepared students have enrolled, accusations of dumbing down the curriculum have escalated.

What lesson can we learn from the toilet paper industry? Once American society has become accustomed to a particular approach to a particular problem, it is very difficult to move it to try something new. It makes no difference that the new product or service may be less expensive in the long run, and a better use of natural resources. It takes overwhelming pressure to introduce a new behavior and have it take hold a significant segment of society.

For those of us who are old enough to remember the early days of cable television, we can’t forget the overwhelming pressure from the ubiquitous MTV ads that shattered our ear drums with the droll, repetitive chant “I Want My MTV!!!” MTV hooked the adolescent crowd with a constant barrage of their ads and free introductory offers of music videos . For those of us who were somewhat beyond the adolescent years, we had athletically inclined ESPN, the first 24-hour sports and entertainment network. Fortunately, there was more sports than entertainment. Who can forget camel races, ostrich races and Australian rules football? Once the American public was hooked, ESPN is now a staple on all cable and satellite systems, usually with multiple channels. What’s the secret? Start early and small with a product that people want, then keep feeding them the candy to get them addicted.

Is it too harsh to suggest that we need to get people addicted to education? We need to start hooking them on education early. Trying to get the late adolescent or an adult to see that they need education is too late. Talking to an early adolescent about the need to read can be like talking to a brick wall. We need to introduce children to books before they start schools. Kindergarten may be too late. This was the conclusion of the report STEM and Early Childhood — When Skills Take Root, commissioned by Mission: Readiness, a nonpartisan national security organization of more than 600 retired generals and admirals calling for smart investments in the upcoming generation of American children, and ReadyNation, an organization of more than 1400 business leaders who work together to strengthen American business through effective policies for children and youth.  If we were to follow the recommendations of “When Skills Take Root” it would mean that parents would be responsible for introducing books and learning to their children at pre-K ages. That’s a tall order in this society, when many adults have not read a book in years.

Trying to get the late adolescent or an adult interested in educational programming that forgot them years ago is nonsensical. Attempting to lure a late adolescent or adult into academic programming that uses approaches that they rejected years ago is a nonstarter. We need to go where they live and think like they think. We must bring the reticent adolescents and adults slowly into the light. We need to speak their language and use their media and methods as a starting place. I know this goes against grand educational traditions, It is NOT how we learned. That doesn’t matter. We are in a war for peoples’ minds and we need to use the most effective weapons. If we don’t have those weapons in our arsenal, we need to add them. I know that this doesn’t solve our immediate problems. However, I can almost guarantee that it will eventually bare fruit, both for the general public and for IHEs.

Pair of boots, service rifle, and helmet stand in tribute to fallen soldier; courtesy of largeart.com

This next two paragraphs are probably the strongest statement that I have ever made about the future of higher education. We are engaged in a war. As in any war, there will be casualties. Some of the casualties will be civilians, while others will be educators. We will not educate every adolescent or adult in society. However, we have a responsibility to try to save and educate as many civilians as we can. Some we will lose because they refuse to help themselves. If  individuals refuse to be educated, we can’t force it on them. Some we will lose because we don’t have the forces to reach them or we have deployed our assets incorrectly. We need to carefully study our battle plans to reach as many as we possibly can. We will lose some educators in the battle, because we haven’t trained, equipped, deployed or supported them properly. These loses are the most unfortunate because they could have been prevented.

We will also lose some IHEs along the way. We lost four within the past month with the announcements that St. Catharine College (KY), Dowling College (NY), Wright Career College (KS) and Burlington College (VT) will close their doors this summer and not offer classes this fall. Some IHEs will find themselves in untenable financial positions from which they can’t recover. The most unfortunate cases are probably those that we lose to friendly fire. If you are uncomfortable talking about the future of higher education in these terms, then I suggest that you might look for another profession. This war is only going to get messier. I am not a prophet of doom. Higher education will survive this onslaught and will regain some high ground. Will it recover all of its loses? It is possible, but not likely. However, the new emerging higher education will be different from the higher education of the late 20th century.

I began this post referring to a post in which I compared higher education to the watch, chocolate and toilet paper industries. In future posts, I will deal with the watch and chocolate industries. In the meantime, I would not recommend TPing anyone’s house or car.

Filed Under: Business and Economics, Higher Education Tagged With: Casualty, College, Economics, Innovation, Metaphor, War

May 14, 2016 By B. Baylis Leave a Comment

The Paradigm of Surviving and Thriving

Rebekah Basinger’s Generous Matters blog post Surviving, Thriving and Six Degrees of Separation has started an avalanche of thoughts in my mind. My initial thought was that Rebekah is working with a Surviving/Thriving Paradigm. This paradigm can outline a common pattern of organizational behavior. Undeniably, from reading Rebekah’s post, I know that it is specifically being applied to ministries and organizations. As I continued to delve into the steps of separation, I came to see a natural and obvious spill over of applications of this paradigm to for-profit businesses. However, during those periods of semi-consciousness when I was trying to go to sleep and trying to wake up, my thoughts settled in on a number of very wild, but related ideas. This concept could also have traction for individuals. In addition, if we can apply the ideas generated in these thought games to individuals, ministries and businesses, would it not make sense to try to scale them up the organizational ladders? Can we apply the Surviving/Thriving Paradigm to whole industries and even countries? We may just be following in the footsteps of Paul Kennedy with his book The Rise and Fall of the Great Powers, or Karen Blumenthal with her biography, Steve Jobs: The Man Who Thought DIfferent. 

from Presenter Media

It’s not the first time that I have had similar thoughts. One thought in particular has been the cause of nightmares on occasion: “Does the Higher Education Enterprise go through periods of thriving and just surviving?” You will notice that in deference to some of my sisters and  brothers in higher education, I didn’t use the term “industry.’  In June 2010, I  published the post What does higher education have in common with the watch industry the chocolate industry and toilet paper manufacturers?  I am convinced my watch/chocolate/toiletpaper  post is directly related to the surviving/thriving topic. In my post, I first looked at how the watch industry was completely revolutionized by the introduction of a new technology and a new idea. Watches didn’t have to run on jewels and finely manufactured gears. Time be could kept by crystals excited by electrical current. Watches didn’t need dials to tell you the time. They could do it with lighted numerals. Watches didn’t need to be expensive works of art to be useful. Not everyone wanted an expensive piece of jewelry that told time. This revolutionized the watch industry right out from under the noses of the staid, historic brand names, some of which disappeared. They were replaced by upstart technology firms that had little concern about beauty, with the exception of Steve Jobs and Apple, who had a new definition of beauty. In comparing higher education with the chocolate industry, I focused on two extremes within the chocolate industry which were able to bifurcate the industry and not only survive, but thrive. Not everyone wanted the expensive Dove, Ghirardelli, Godiva or Cadbury chocolates, but these chocolates were still able to maintain a sizable market share and thrive as businesses. At the same time Hershey thrives with a completely distinct market, pricing structure and marketing plan. The third example in my post, toilet paper, is a product that has been used universally for many years. Over five centuries the distribution plan in this industry has radically changed. The old methods have been completely replaced by a new model. Is this a warning for higher education? Are we unnecessarily flushing money down the drain?

from Presenter Media

I published a second post in June 2010 entitled: Comparison of American Higher Education with the American Automotive Industry. In this post I obviously attempted to compare American higher education with the American automotive industry. This was not a great time for the American automotive industry. In my post, I outlined some of the problems that brought into question the survival  of the upper midWest, rust belt automotive industry. A November, 2005 WSJ piece A Tale of Two Industries posed doubts about the health of the American automotive industry that had ruled the roost since the middle of the twentieth century. This article began with a story that hit home to a number of people who had been our neighbors when we lived in Indiana. Grant County, Indiana, had been reliant on heavy manufacturing since WWII. General Motors was the county’s largest employers. Buried in the WSJ article was an announcement that GM was closing its Marion plant and eliminating 2,000 jobs. This hit the small county seat very hard. The county’s unemployment rate was already hovering around 10%.

In my post, I noted the similarities between the decline of the once dominant model in the American automotive industry of manufacturing plants in the upper midWest with the rise of a “second American auto industry” in the South. This new competitive model was providing lower cost cars while still paying employees well for what they had been receiving in the new region. By 2005 it had captured 26% of the market for all new cars made in America. The WSJ article suggested that this switch came about because the old model of producing premium cars at premium prices no longer was bought unquestioningly by the American consumer. They were staging a price strike.

from Presenter Media

Meanwhile headline after headline each week, in educational news outlets, as well as the general public press, announced the closing or merging of colleges and universities. Many pundits were predicting the demise of higher education as we knew it. Why all of the gloom and doom? However, in my research of college closures, I found that the first decade of the 21st century was the decade with the fewest closures or mergers since 1850 when people started keeping track of these things. In my post I postulated that this reading of conditions by the higher education community was what I suggested was the Crab Pot Syndrome. Higher education had just experienced enrollment and building booms in the last two decades of the 20th century which had only been surpassed by the boom created by the return of WWII soldiers and the GI Bill. In addition, many proprietary institutions were prospering, as well as the online educational operations of public flagship universities and many residential liberal arts colleges. Why? They were providing a product at a reasonable price in a fairly convenient format for a public which did not believe that the premium that the residential liberal arts colleges and flagship universities were charging was worth the difference in price. On the whole American higher education seemed quite comfortable. It could be compared to a crab in a pot of water sitting on a stove, before the heat is turned on. The crab just sits there lounging in a pot. As the heat increases, it actually begins to enjoy the warmer water. It isn’t until the water almost reaches the boiling point, does the crab realize that it is in trouble. It begins to try to claw it’s way out of the pot. However, by this time it is too late, and this crab will soon be eaten for dinner.

from Presenter Media

At the conclusion of my aforementioned post I stated that: “I think we should be taking seriously the question raised by Joseph Marr Cronin and Howard E. Horton in their May 22, 2009 Commentary in the Chronicle of Higher Education entitled, Will Higher Education Be the Next Bubble to Burst?“ In the six intervening years since I wrote that post, a number of events have dramatically changed the landscape of higher education. Do those events alter my conclusions? My first conclusion now is that the bubble has already burst. As a fallout to that explosion, I would now say that we MUST reevaluate the whole enterprise of American higher education. This reassessment must answer all of the following questions concerning a new American higher education paradigm:

  1. What are the appropriate differences between the public and private education sectors?
  2. What roles should the federal and state governments play in public education?
  3. Do the federal and state governments have any role in private education?
  4. Who pays what in this new paradigm?
  5. What role do student loans pay in this new paradigm?
  6. What role does accreditation play in this new paradigm?
  7. What role should proprietary institutions and corporate universities play in this new paradigm?
  8. What role should career and technical training play in the new paradigm?
  9. What role should online education, eLearning and MOOCs play in the new paradigm?
  10. What role should non-traditional learning modalities play in the new paradigm?
  11. What role should badges and credentials play in the new paradigm
courtesy of GrahpicStock

I don’t want to be Chicken Little running around yelling “The sky Is falling! The sky is falling!” However, if we are not careful, it is quite conceivable that the tornado that is bearing down on us will level our enterprise and scatter the debris of what’s left all over creation.


Filed Under: Business and Economics, Higher Education Tagged With: College, Economics, Surviving, Thriving

  • « Go to Previous Page
  • Page 1
  • Page 2
  • Page 3
  • Page 4
  • Interim pages omitted …
  • Page 6
  • Go to Next Page »

Primary Sidebar

Search

Tags

Admissions Advent Alumni Aphasia Books Caregiver Christmas College Communication Community Activism Condition Disease Disorder Dysesthesia Economics Educational Modality Epilepsy Family Fundraising God Hallucinations Health Care History Humor Knowledge Learning Liberal Arts Love Metaphor Parkinson's Peace Philosophy Problem Solving Reading Recruitment Retention Scripture Student Technology Therapy Truth Verbal Thinking Visual Thinking Word Writing

Categories

  • Athletics
  • Business and Economics
  • Education
  • Faith and Religion
  • Food
  • Health
  • Higher Education
  • Humor
  • Leadership
  • Neurology
  • Neuroscience
  • Organizational Theory
  • Personal
  • Politics
  • Surviving
  • Teaching and Learning
  • Thriving
  • Uncategorized
  • Writing

Meta

  • Log in
  • Entries feed
  • Comments feed
  • WordPress.org
  • Home
  • Blog
  • Overview

Copyright © 2010–2025 Higher Ed By Baylis