• Skip to primary navigation
  • Skip to main content
  • Skip to primary sidebar

By's Musings

  • Home
  • Blog
  • Overview

Tuition

August 3, 2016 By B. Baylis Leave a Comment

The Business Model of All of Higher Education is Broken — Part IV Tuition and Fees

from Presentation Media

This is the fourth part in a series on the economic conditions in higher education. The preceding post, The Business Model of All of Higher Education is Broken: Part III — Tuition and Fees, dealt with the history of the revenue stream generated by tuition and fees over the past 40 years. American higher education is divided into two main segments: public education and private education. Much of the American population has a giant misconception about how American higher education is funded. Most students and their families know full well the real financial burden that an education puts on their own budgets. However, it seems that many Americans believe that between government subsidies and the revenues generated by tuition and fees, both public and private colleges cover all of the educationally related  expenditures of these colleges. Most surveys suggest that the American population does not believe that American higher education is experiencing a real financial squeeze. On the other hand, surveys such as Inside Higher Ed’s Annual Survey of Chief Business Officers, tell a very different story. More college officials are starting to worry about the future of American higher education. While this debate rages, some current politicians are espousing the idea that the public institutions should be tuition free. Many independent analyses of this idea suggest that there are untold, hidden dangers in this bold plan. It looks like I just suggested the addition of at least two more posts to this series on The Business Model of All of Higher Education.

from Presentation Media

However, as promised this post will concentrate on the question of how much of college budgets are actually covered by students’ tuition and fees. The most recent compendium of cost data is from the January 2016 Delta Cost Project, at the American Institutes for Research (AIR), Trends in College Spending: 2003 – 2013.  This report is the most recent in a series of reports sponsored by the American Institutes for Research (AIR). These reports focused on two questions: 1) Revenues: Where Does the Money Come From? and 2) Expenditures: Where Does It Go? What Does It Buy?  In addition to the Delta Cost Project, expenditure data can be extracted from the Integrated Postsecondary Educational Data System (IPEDS) data base. Unfortunately, the Delta and IPEDS data do not segment their data in the same manner. In addition, the Delta study has not consistently used the same segmentation.

Data exacted from Delta Costs Studies and IPEDS data base; supplemented by author’s calculations

The Delta Study prior to 2013 used only six segments of institutions. There were three for public institutions: Research Universities, Master’s Universities, and Community Colleges. The three private categories were: Research Universities, Master’s Universities, and Bachelor’s Colleges. In 2013, the Delta Study added a seventh segment: Public Bachelor’s Colleges. In attempting to extract the data from the IPEDS data base, one must be careful because some college and university systems submitted data for individual institutions, while others submitted system-wide data. In using the IPEDS data for this post, I tried to break down data into seven segments. I can’t guarantee the absolute accuracy of all of my calculations. However, since the data seemed to fall in line with the Delta data, I am comfortable in using my data for general inferences.

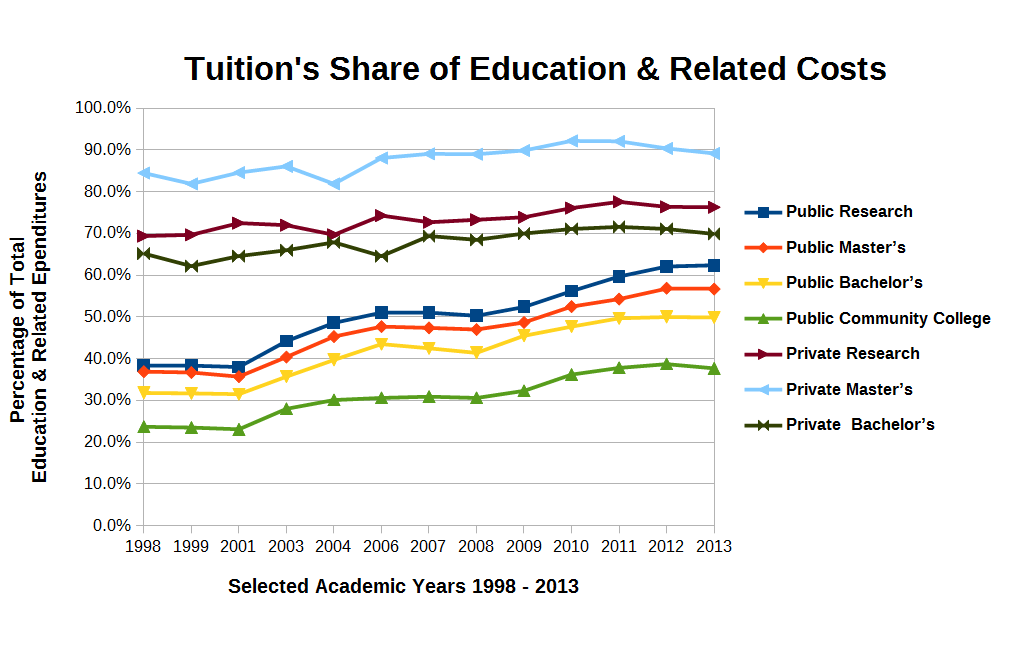
There are at least four mysteries or questions that we can derive from the data in the chart above. The first is that the private institutions use more of tuition dollars to pay for Education and Related Costs (E&R Costs). This is not totally unexpected since public institutions by definition get more support from governmental sources. There is another question lurking in the weeds. The graph of E&R Costs for private institutions are much closer to flat lines than the more sharply increasing lines for public institutions. What are the causes of these sharp increases? Is this a subject for another post?

from Presenter Media

In terms of funding for Public Institutions of Higher Education (IHEs), federal and state politicians have been passing the football back and forth like a hot potato for the past quarter of a century. After many years of stability or growth, the percentage of total spending at state universities provided by state tax revenue has been sinking since 1990. In attempting to explain drastic increases in tuition and fees for Michigan residents, Jim Duderstadt, President of the University of Michigan from 1988 to 1996, told students, state legislators and the general public, “We used to be state-supported, then state-assisted, and now we are state-located.” In the Commonwealth of Pennsylvania, the State System of Higher Education is comprised of 14 “state owned” universities. The state contributes $3,900 annually per student while in-state students pay $10,052 annually in tuition and fees. For the state-supported, flagship institution Penn State University, in-state students pay $17,514 in tuition and fess while the state contributes $3,000.  Michigan and Pennsylvania are not the only two states that have “privatizing public higher education.” Thomas G. Mortenson began a Winter 2012 post, State Funding: A Race to the Bottom, on the American Council on Education (ACE) website on the Leadership and Advocacy page with the following statements:

State appropriations for public higher education have just faced another tough year. And yet, public institutions have faced many such years over the past three decades. Despite steadily growing student demand for higher education since the mid-1970s, state fiscal investment in higher education has been in retreat in the states since about 1980.

In fact, it is headed for zero.

Based on the trends since 1980, average state fiscal support for higher education will reach zero by 2059, although it could happen much sooner in some states and later in others.

I have one question for all the zealous politicians calling for tuition-free, or even debt-free public education: “Flying in the face of these current trends, where are you going to get the money to make up these differences?”  These conundrums sound like the material for additional posts.

from Presenter Media

The second question raised by the chart, Tuition’s Share of Education & Related Costs,  relates to the percentage of student tuition dollars that Private Master’s institutions devote to E&R Costs. These data help bring to light one of the most poorly kept secrets in higher education. Master’s programs can be cash cows for institutions. Traditionally, many master’s degree programs, such as MBA’s, MED’s, and MA’s in humanities, have not given out large amounts of financial aid to students. Master’s degree students in these areas come to the institutions without any expectation of financial aid from the institution, nor from current employers, if they have current employers. Thus, they tend to pay full tuition out of their own pockets, using loans to make up any differences they can’t fund out of their own savings and earnings. This frees up more money from the subsidy sources for institutions to use in other ways. Do these points provide us topics for additional posts?

The third question relates to three obvious declines in the percentage of student tuition dollars used to fund E&R Costs in the above data. The first two occurred in 2003 in the Private Research and Private Master’s universities. There are also drops in the Private Bachelor’s colleges and Public Master’s universities. These occurred in 2004 and 2006 respectively. This question has two parts. The first part is “Why did institutions decrease their dependence on student tuition dollars?” The second part is “Why did these declines occur at different times?”

The fourth mystery relates to the relative slope of the graphs of the public institutions. The Public Community Colleges have the slowest growth rate of all public institutions. Why have they been able to keep from dipping into the student tuition dollars to fund more of the E&R Costs? Do they know something or are they doing something different from the public four-year institutions?  Is this a topic for another post?

I believe that I have come to a good transition point in this discussion of Tuition and Fees providing additional funds for American colleges. If we can’t raise what each student pays, the next logical choice would be to get more students paying the base tuition and fees. The next post will deal with the problems of increasing the number of paying students going to college.


Filed Under: Business and Economics, Higher Education Tagged With: Budget, College, Economics, Subsidy, Tuition

July 18, 2016 By B. Baylis Leave a Comment

The Business Model of All of Higher Education Is Broken, Part III – Tuition and Fees

from Presenter Media

In this current post, I return to the discussion of the Business Model of All of Higher Education. In a previous post, The Business Model of All of Higher Education Is Broken,  I introduced the five sources of revenue for Institutions of Higher Educations(IHEs): 1) Tuition and fees; 2) Fundraising, advancement and development efforts; 3) Endowment income, appreciation, interest and dividends; 4) Auxiliary enterprises; and 5) Governmental appropriations. In this post, I had originally planned to consider all of those sources of revenue in one post. However as I began to work with that idea, I found the explanations growing too large for one post. In addition, no matter how hard I cranked the revenue generating machine for each revenue source in an attempt to create additional funds, I discovered that increasing the effort in any given area did not produce a commensurate return on investment (ROI). Therefore, I decided that I needed to expend more time and coverage in this series to each source of revenue to give it the analysis I felt it deserved.  Thus, I have decided that I will begin to plan to cover each of the revenue sources individually in separate posts. As I get into the ins and outs of the revenue source, I may have to add more posts. I begin this process with the source of revenue with which all students and their families are most familiar, Tuition and Fees . It is also the revenue source that the general public most clearly associates with Institutions of Higher Education (IHEs).

from Presenter Media

The revenue from tuition and fees obviously depends upon enrollment. This means that there are really only five ways to increase the useable revenue from tuition and fee. These five possibilities are:

  1. increase the tuition and fees, thus increasing the base amount each student pays;
  2. increase the number of students paying the tuition and fees, i.e, increase tuition-paying enrollment;
  3. decrease the discount rate on tuition, thus decreasing the average amount of institutional financial aid given to enrolled students;
  4. change the model of teaching and learning in order to increase the efficiency of the use of this revenue stream;
  5. do a combination of two or more of the above at the same time.

With points 3 and 4 above, I apologize for sneaking the expenditure side of the business model into the conversation. However, much of the general public acts as if it believes that tuition and fees cover the cost of a college education. This is definitely not the case, and has not been the case since the beginning of formal American higher education in the mid-17th century. Since this rabbit trail would take us deep into the expense side of the budgets of IHEs, I will leave the exploration of this topic to another post. I will devote the remainder of this post to just addressing the issue of increasing tuition and fees. I will cover the problems of increasing the number of students, decreasing the discount rate and changing the model of teaching and learning in additional posts.  I will also address the four other IHE revenue sources in additional posts.

from Presenter Media

When IHEs announce tuition increases each spring for the following fall, it is usually met with varying degrees of disdain. Students, parents, the general public, as well as federal and state governments are already enraged at the current level of tuition and fees. The data are clear. Tuition and fees have increased at rates exceeding the annual general inflation rate for years. Just at the suggestion of another increase, the reaction varies. It runs the gamut from a reluctant acceptance to a loud murmur to a campus uproar and rebellion.

The following three charts use the same data extracted from the College Board Pricing Trends, which has the most comprehensive collection of data on college pricing trends. Although the charts are based on the same data, they give us three different pictures of the history of Tuition and Fee Increases over the past 40 years. Why have I chosen to present this information in three ways? It is to try to help my readers understand that there are different ways to look at the same data and that one’s first impression may not be the only or best way to view the subject.

The first chart is a 40-year history of tuition and fee increases in “current  dollars,” i.e, the average list price of tuition and fees for all colleges in a given segment weighted by full-time undergraduate enrollment. These list prices are compared against the 40-year average increase in list prices. The current dollar tuition and fees are the prices that students, their parents, and government officials will see first. These are the dollar figures against which everyone reacts. The first impression from the graph is how similar the tuition and fees were for all three segments in 1975. Based on the scale of this graph, it is almost impossible to distinguish the price of the four-year, public institutions and the two-year, public institutions. Although the private, four-year institutions were more expensive, on the scale of this graph, in 1975 they did not appear “that much more expensive.”

CHART 1: History of Tuition and Fee Increases Compared Against 40-Year Average Annual Increases

The second impression that this graph conveys to me relates to how the actual increases fall below the projected increases based upon the 40-year average annual increase. This means that the early increases were less than the average annual increases and it took quite awhile for the actual increases to catch up with the average annual increases. It appears that the sharp increases in both public and private four-year schools occurred in the period from 2000 to 2010.  This would coincide with decreased support from government appropriations for financial aid.

This graph clearly gives the impression that the gap between the three segments has grown significantly. This is the feeling that students and their parents get when they start looking at colleges and the tuition prices. The fourth and fifth impressions that this graph gives me revolve around the two-year public institutions. The first of these impressions is how much more affordable this choice seems compared to the other two choices. The second impression is how close to a straight line the actual increases appear. To me, and many other commentators and critics of higher education,  this raises the spectre of whether these institutions “know the secret” for holding down tuition increases.

The two primary conclusions that many will draw from this graph are: 1) the two-year, public institutions are the most affordable choice for an education; and 2) the four-year, private institutions have had uncontrollable tuition increases over the past 40 years.

The second graph, entitled Growth Factors of Tuition and Fees from 1975 to 2015 Across College Segments, Selected Academic Years, portrays the same data that the first graph did, but gives a very different slant to that data. This chart tells us how fast tuition and fees grew. Surprisingly, it says that the time to double has been relatively constant. In rough terms throughout the 40 years from 1975 to 2015, it has generally taken 15 years for tuition in any of the college segments to double.

CHART 2: 40 Years of Tuition and Fee Growth Factors

SInce the blue bars representing the public, two-year institutions increase in height the most consistently, this is another verification of the steady, almost constant rate of growth of tuition and fees for the colleges in this segment. During the first 20 years, I find it very interesting to note that the public, two-year institutions increased their tuition and fees at the fastest rate, while public, four-year institutions at the slowest rate. In the second half of the 40-year period, the growth rate of public and private four-year institutions shot up, far out stripping the two-year public institutions. Does this represent a shift in public funding priorities for higher education?

Although the growth factors were very close since the private four-year institutions started out with higher tuition and fees, doubling the higher rate increased the differential. Thus, the actual dollar spread in tuition did indeed produce growth.Two different graphs give you two different pictures.

The third graph is entitled the Five-Year Percentage Changes in Tuition and Fees Across College Segments, From 1975 to 2015. This graph plots the percentage change in tuition and fees over five-year periods from 1975 to 2015. This graph gives one a very different picture of tuition and fee increases over these 40 years.  The overall trend of data points in this graph are actually decreasing. This doesn’t say that tuition and fees are decreasing. What it says is that the rate of change is slowing.

CHART 3: Five-Year Percentage Change in Tuitions and Fees, 1975 to 2015

Looking at the three different sets of points and lines joining those points, it is not surprising that the blue points representing the two-year, public institutions show the least variation. That confirms what we have seen in the other two graphs. The red points show the most variation away from a straight, decreasing line. The four-year, public institutions have been the institutions most affected by the whims of state legislatures or governors. Again, even though the rate of increase for private, four-year institutions is slowing down, don’t look for the public, four-year institutions to catch them in list price anytime in the near future.

Chart 1 hit me right between the eyes. To those who can remember, I challenge you to go back to your college days and put your tuition and fees into an appropriate year in the chart. For some of us we will have to add lines at the beginning of the chart. My experience would extend the chart another 10 years to the left. In the early sixties at the flagship university in a small state, I never paid more than $175.00 annual tuition plus $10 lab fees per science course, which usually added $20 or $30 per semester. Since computers were just coming into use, as a mathematics and physics major I had to pay a $25 per semester technology fee for the right to put my card decks in the hopper each night and come back the next morning to get the print out from the pin-fed line printer. In addition, as a commuter, I had to pay $50 per semester for a “hunting license” to try to find a parking space in an on-campus parking lot. Thus, my total annual tuition and fees bills were less than $550. My textbooks and supplies were less than $150 per semester. I lived at home, and my mother never charged me anything for room and board, because I took care of everything around the house since my father died during my freshmen year in college. Gasoline averaged about $0.30 per gallon, and I spent maybe $10.00 per week to keep my car in gas, and $25 per week for coffee and lunches. Thus, my total out-of-pocket expenses to go to college were less than $2000 per year, or $8000 for my entire undergraduate education. If you subtract the $6000 in scholarships that I won or was awarded, my B.S. degree in mathematics cost me less than $2000 out of pocket. Even in early 1960 dollars, that was entirely possible to pay for out of summer or part-time school year earnings. For my four years in graduate school, I had a fellowship that paid tuition and living expenses. I didn’t pay one nickel out of pocket for my Ph.D. I graduated in eight years of schooling, with a B.S. and a Ph.D.in mathematics, with a wife, a child, a house, two cars, money in the bank, NO DEBT, and an offer of a tenure track job! In today’s world that would be definitely an anomaly. According to CNN, for the most recent year for which data is available, the undergraduates of the class of 2013 walked off the commencement stage with an average debt of $35,200, while Ph.D. graduates “stumbled” off the platform with an average debt of $57,600. Among Ph.D.s, more than 28% had debts of more than $100,000. The average J.D. and M.D. graduating from Law School and Medical School respectively, had a debt of more than $140,000. Much has been written and debated about the debt bubble that has overtaken or is overtaking American higher education. It looks like I have created at least one more blog post on the Debt Bubble.

from Presenter Media

Why does this picture look so bleak? I believe it looks bleak because we could be on the verge of very bleak times for higher education. American higher education is heading for a perfect storm, unless it changes course or one or more components of the storm change direction. A perfect storm is the confluence of events which individually may not necessarily be dangerous, but the combination of these events creates a potentially disastrous situation. Here, too, I am taking you to the suspenseful edge, and leaving you to dangle. The perfect storm will be another post in this series on the broken business model of American Higher Education.

http://www.hamiltonproject.org/assets/legacy/images/uploads/thp_image_uploads/charts/college_cost_large.png#college%20cost%20chart%20520×520


Filed Under: Business and Economics, Higher Education, Politics Tagged With: Auxiliary Enterprises, Bubble, Business, Business Model, Debt, Economics, Endowment, Expenditure, Fundraising, Ministry, Return on Investment (ROI), Revenue, Service, Systemic Thinking, Tuition

May 7, 2016 By B. Baylis Leave a Comment

The Business Model for All of Higher Education is Broken

from Presenter Media

I recently came across a very thoughtful and extremely well-written blog post This Needs to Be Run More Like A Business written by Jason McNeal. In this post, Jason gives an impassioned plea for a different approach to private education since “the business model approach to higher education is helping to discourage giving.” Jason suggests that board members and I would assume he would include administrators should know better than to say, “Our business model in higher education is broken.”  I am sorry Jason, but “The Business Model for All of Higher Education is Broken.” I say this as an administrator with 40 years of effective service in private higher education.  I have also spent considerable time praying, studying, thinking and writing about higher education. You do make a valid point when you imply a criticism of the board member’s statement, “I simply do not understand why our tuition and fees are not sufficient to cover our costs.”  In the worlds of private, non-profit, higher education and public, higher education, no traditional college or university covers its education and general costs with just tuition and fees. It is like one individual in a sinking rowboat trying to bail out the boat, with other sitting by, just watching and doing nothing to help. This model is broken. However, the model of using a leaking boat to try to get across a lake is also broken.

from Presenter Media

Why do we want to get across the lake? We want to build an excellent education that works for students, faculty, and the general public. This education must be affordable for everyone involved, including the students, faculty and the general public. This education must be sustainable not only in the short run but for the long run. I, for one, see problems in all the current approaches that we are using to reach these goals. For 40 years, I tried to work toward these goals in the best way that I could. I had some successes, but I also had some failures. I will discuss some of both in future posts. Why? Because we can learn from both our successes and failures. When Thomas Edison was asked about thousands of experiments on light bulbs that didn’t work, he is reported to have said, “We haven’t failed. We now know a thousand things that won’t work, so we are much closer to finding what will.” When we find something that partially works, we should try to determine why and what we could do to make it work better. These are the steps to success. Let’s work together to bail out the leaky boat, find the leak and fix it. Then we can row together across the lake to the land of success, where we will have excellent, affordable and sustainable education for all.

We can begin by looking at two partial successes. The two areas where we see tuition and fees possibly covering all the costs of fulfilling the educational mission of the institution are non-traditional higher education and proprietary, for-profit, higher education. I say “possibly” because more than half of the non-traditional programs or for-profit institutions lose money and eventually fail. The traditional higher education institutions have been variously described as time and location fixed, brick-and-mortar, bastions of teacher-centric delivery of education to late adolescents recently graduated from high school. Non-traditional education disrupts one or more characteristic of traditional higher education. In other blog posts, I will speak more about the differences between traditional and non-traditional higher education.

Institutions of higher education have five sources of revenue. I am sorry if I offend educational purists who do not want to use business terminology to describe operations within higher education. In using the term “revenue”, I did resist the temptation to use the more highly-charged business term “income.” Thus, I will label money coming into the institution to pay for the operations of the institution as “revenue.” There can be no argument that colleges are required to pay operating expenses like salaries, fringe benefits, construction and maintenance costs, utility and insurance costs, supply, equipment and service costs. Since I am focusing on the revenue side of the institution in this post, I will reserve discussion of the expense side to other posts.

There are four sources of revenue for the not-for-profit segment of higher education. There is a fifth source for public institutions.The five sources of revenue are:

  1. Tuition and fees;
  2. Fund raising, advancement or development efforts;
  3. Endowment income, appreciation, interest or dividends;
  4. Auxiliary enterprises;
  5. Governmental appropriations (Reserved for public institutions).

There are two very distinct ways to look at these sources of revenue. The first is how the general public sees these categories of revenue. The second is how colleges and universities are legally required to report them in audit statements. (OOPS, another hint at the trouble lurking within the presence of the higher education business model) In this post, I will restrict my attention to how the general public understands these five sources of revenue. In future posts, I will discuss how colleges are forced to handle and report the revenues associated with these categories.

from Presenter Media
  1. Tuition and fees: These are the charges (I apologize for another business term) the institution individually imposes upon students for the privilege of attending and obtaining an education, and possibly a degree or some other credential. By “tuition” I mean that portion of the financial obligation imposed upon students for enrolling in classes. By “fees” I mean extra charges for a number of other things such as student services or activities, laboratory, clinical, internship, practica, music, travel, technology, special class charges, health or insurance fees, parking fees, and a myriad of other add-ons such as application, matriculation, course change, graduation and transcript fees, . I also throw into this category “Room and board charges”  because these charges are individually assessed to participating students. These are the financial obligations imposed upon students who reside and eat in college-owned or operated facilities. The students and their parents see these charges on their college bill (a residue of a business model). Student and their parents refer to these charges as the total cost or the price of attending. I haven’t yet considered financial aid. Whether the financial aid is not from the institution or comes directly to the student as a government appropriation, it is usually considered a discount by the students and their parents Either way, when we get to the accounting of financial aid, it must be treated as a cost to the institution(another business model problem lurking in the forest).

    from Presenter Media
  2. Fundraising, advancement or development efforts: For the private, non-profit, and public segments of higher education, this category includes all charitable gifts and donations. These gifts may be in the form of cash, stocks, bonds, or physical property, including real estate, art, supplies, or equipment. They may also include services in lieu of payment. This category seems to be the area about which Jason is most concerned. From reading Jason’s blog, I know he doesn’t consider fundraising and development work as begging. However, in the eyes of many of the general public, this is what it comes across as. In the for-profit segment of higher education, this category also includes what is known in financial circles as the investment of assets. Investments are the purchase of assets with the hope of generating a profit. Investments are not always profitable and may incur a loss. Many colleges and universities, across all segments of higher education, raise funds through gifts that are known as grants. Grants are funds or products that do not have to be repaid given by the grant maker, which can be a government department, corporation, foundation or trust to a recipient. Usually, grants are awarded after the recipient has made a written request for funding of a specific project through a process that is known as grant writing. Most grants that are awarded will require of the recipient some level of verifiable compliance and reporting of outcomes. In future posts, I will consider the topic of university fundraising, including its rewards and perils.

    from Presenter Media
  3. Endowment income, appreciation, interest or dividends:  By an endowment, I mean a financial asset, which normally came into the possession of the institution in the form of a gift or donation. Endowments may or may not have a stated purpose at the bequest of the donor. This category of revenues also includes the return or dividends on the investment of charitable donations. It also includes the appreciation in value of the gifts that the colleges and universities are holding in “trust.” Most endowments are designed to keep the principal amount intact while using the investment income from interest or dividends for the “charitable” efforts of the institution. By “charitable” efforts, I mean those efforts which contribute to the stated primary mission or purpose of the not-for-profit institution. This category also includes what are commonly known as “quasi-endowments.” These are funds set aside by the institution from institutional funds. These funds may have come from donors or excess institutional funds. As with “endowments” the principal of quasi-endowments are reserved, and only the interest or dividends are expended. The management of endowment principals and investment demands close scrutiny on the part of professional managers, whether internal or external to the organization. In future posts, I will deal with the topic of endowments and their management.

    courtesy of GrahpicStock
  4. Auxiliary enterprises: Auxiliary enterprises are entities that exist to furnish fee-based goods and services to the general public, students, faculty or staff, acting in a personal capacity and not as an agent of the institution. Auxiliary enterprises should be self-supporting in the sense that the revenue covers the full direct and indirect costs of providing the goods and services. Some definitions of auxiliary enterprises exclude areas that are outside the core functions of an academic institution. For all academic institutions, core functions would include teaching and learning activities. For many, they would include research activities. For some, they would also include service activities. such as agricultural extensions for land-grant institutions.  There are many possible uses of the wealth of physical facilities associated with a college or university, which could be used outside the core functions of the college. There is an army of experts at a college which could be deployed to service students and the general public in areas outside the core functions of the college.  When auxiliary enterprises produce a surplus of revenue over expenses, those surpluses may be used to offset budgetary deficits in any area of the institution, including areas essential to the mission of the institution. Although there are many calls for colleges and universities to stick to their knitting, and stay clear of auxiliary enterprises, these programs may be a way for a college to fill in some budget gaps. I will speak to this argument in a future post.

    from Presentation Media
  5. Governmental appropriations: With recent rulings of federal and state courts, Departments of Justice and General Accounting Offices, this category may seem to be reserved for public institutions. Because education is not mentioned in the United States Constitution, including its ByLaws, it is one of the areas reserved for the prerogative of the states. However, Congress has enacted certain laws with which all employers and public buildings must comply. In addition, there is a federal Department of Education (DOE). The DOE exists primarily to safeguard the federal investment in education. This investment comes from the billions of dollars over the years that have been designated for educational concerns by Executive Orders and Federal Appropriations approved by the US Congress. These monies have been augmented by state and local appropriations. Although direct appropriations primarily only go to public institutions, the federal and state loans and grants to individual students greatly affect the well being of most private institutions. With the acceptance of federal and state funding, colleges and universities must also accept certain increased levels of governmental oversight. Compliance regulations control what colleges can and must do in many disparate areas. These areas include human subject research compliance, environmental health and safety compliance related to research, animal research compliance, export controls compliance, conflict of interest, technology transfer requirements, research misconduct requirements, accreditation, financial aid, FERPA, sexual misconduct (Title IX), Clery Act, drug and alcohol prevention, IPEDS reporting requirements, Title IX athletics administration, gainful employment, state authorization, and equity in athletics data analysis (EADA), immigration, disability, anti-discrimination, and environmental health and safety regulations outside of those related to research. Uncle Sam surfing the dollar is in control. The perverse version of the “Golden Rule: He who holds the gold, makes the rules,” dominates the day here. In future posts, I will discuss governmental funding and compliance issues in higher education.

As with any living organism, colleges and universities ingest monetary resources in order to perform the life functions of growing or producing fruit. For colleges, the desired fruit includes student learning, research and scholarship, and community service. The five categories listed above are the life-giving resources upon which colleges and universities depend. They are the food and water of colleges. If colleges and universities do not get enough funds for their nutritional needs over extended periods of time, they will starve to death. Thus, in higher education, we have three choices. We can 1) increase funding from these sources;  2) cut expenditures, or 3) do a combination of increased revenue and decreased spending. To me, this sounds like a business model. If we look more closely at each of the five funding sources, we will easily find huge difficulties in getting significantly more funds from any of these sources. Due to the length of this post, I will look at those difficulties in future posts.


Filed Under: Higher Education, Teaching and Learning Tagged With: Alumni, Appropriations, Auxiliary Enterprises, Business Model, College, Compliance, Comunnity Service, Economics, Endowment, Fundraising, Research, Tuition

Primary Sidebar

Search

Tags

Admissions Advent Alumni Aphasia Books Caregiver Christmas College Communication Community Activism Condition Disease Disorder Dysesthesia Economics Educational Modality Epilepsy Family Fundraising God Hallucinations Health Care History Humor Knowledge Learning Liberal Arts Love Metaphor Parkinson's Peace Philosophy Problem Solving Reading Recruitment Retention Scripture Student Technology Therapy Truth Verbal Thinking Visual Thinking Word Writing

Categories

  • Athletics
  • Business and Economics
  • Education
  • Faith and Religion
  • Food
  • Health
  • Higher Education
  • Humor
  • Leadership
  • Neurology
  • Neuroscience
  • Organizational Theory
  • Personal
  • Politics
  • Surviving
  • Teaching and Learning
  • Thriving
  • Uncategorized
  • Writing

Meta

  • Log in
  • Entries feed
  • Comments feed
  • WordPress.org
  • Home
  • Blog
  • Overview

Copyright © 2010–2025 Higher Ed By Baylis